

Best Indicators for Trend Trading

Trend analysis is one of the most popular tools for beginner traders. It reveals the general market direction and allows traders to ride the trend or take advantage of a larger price movement in a given direction. Trend traders use technical indicators to identify a trend and take advantage of trading opportunities before it reverses.
The biggest advantage of trend trading is that the strategies are simpler than other trading styles and there are multiple entry points throughout the trend, offering numerous opportunities for traders to take advantage of. However, careful analysis is critical to ensure that trend reversal does not reverse the gains too.
The Need for Trend Indicators
There is no particular price point or duration for the price to be said to be trending. It continues till the direction is sustained. The longer the price maintains direction, the more apparent a trend becomes. Regardless of the trend duration, day traders, scalpers, swing traders, or high-frequency traders can trade a trend based on their trading window. This is where trend indicators are needed. They help traders to:
- Identify a trend.
- Locate exit points.
- Decide when to open long and when to open short positions.
- Identify stop loss and take profit levels.
Top 5 Trend Trading Indicators a Trader Must Know
Trend trading may be done during an uptrend, downtrend, or sideways trend with the right trading strategy. Here are the best 5 trend indicators to help you make informed decisions.
- Simple Moving Averages (SMA)
A plot of moving averages on the price movement chart reveals a trend. Most commonly a 200-period SMA curve is used to identify a trend. If the price is consistently above the SMA line, the market is bullish; whereas it is bearish if the price is below the SMA line.
In addition to the 200-period SMA, often the 20- or 50-period are used to gauge the strength of the trend. If the smaller SMAs are in-sync with the longer ones, it is a signal that the trend will sustain.
- Moving Average Convergence Divergence (MACD)
The MACD indicator uses multiple EMAs (exponential moving averages) to produce buy and sell signals for traders. It uses four lines:
- Signal Line: 9-Day EMA
- Fast Line: 12-Day EMA
- Slow Line: 26-Day EMA
- MACD Line: Difference between the fast and slow lines.
When the MACD line crosses the signal line from below, it is a signal to buy and when it crosses from above, it is a signal to sell.
- Bollinger Bands (BB)
This indicator consists of 3 lines. The middle line is the SMA of the price action. The upper and lower lines (bands) are the standard deviations from the middle line. The bands form a channel around the price, forming the support and resistance levels.
For trend trading with BBs, traders look for a Bollinger Squeeze, i.e., when the distance between the upper and lower bands narrows closer to the SMA. A Bollinger squeeze signals an impending breakout, marking the onset of a trend. Entering a trend early is a great trend trading strategy for improving the chances of gains. However, to make better trading decisions, traders prefer confirming the signals with another indicator. This is necessary because a squeeze only implies that a breakout may occur but not its direction or strength.
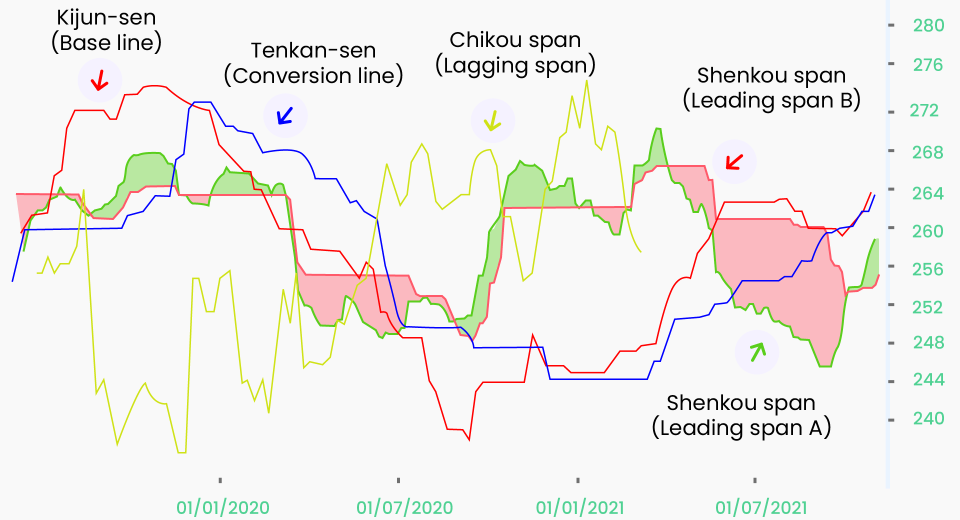
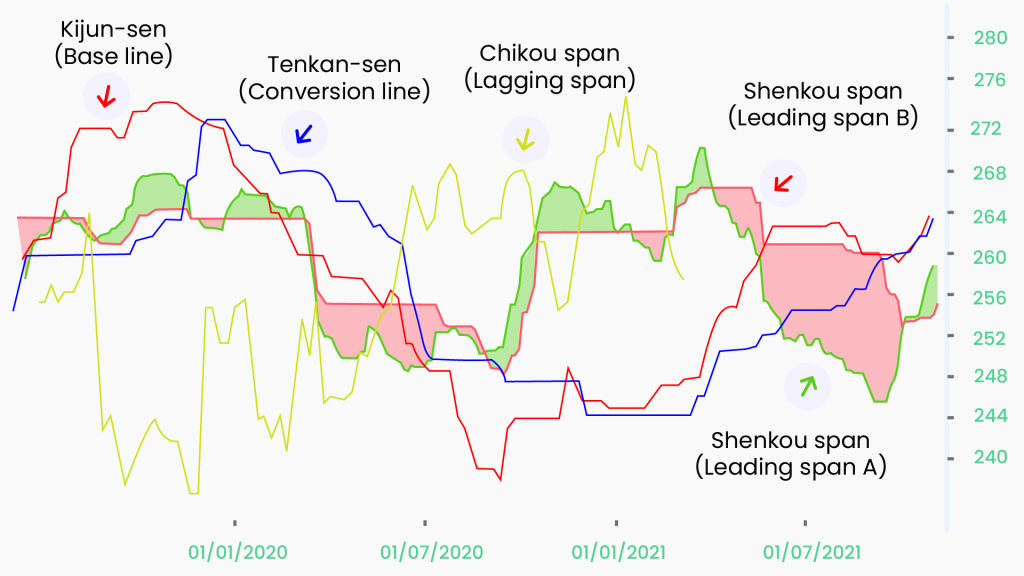
- Ichimoku Kinko Hyo (Ichimoku Cloud)
Due to the multiple lines and zones in which it divides the price chart, the Ichimoku Cloud could appear complex, but it isn’t. Here’s the breakdown of the Ichimoku indicator:
- Kijun Sen: This is the average of the highest high and lowest low of the past 26 days. It is also called the standard line.
- Tenkan Sen: Also called the turning line, this is the average of the highest high and lowest low of the past 9 days.
- Chikou Span: Also called the lagging line, this is the latest closing price, plotted 26 days behind.
- Senkou Span: This is a span encompassed by two lines. The first is the average of the turning line and the lagging line, plotted 26 days ahead. The second is calculated by averaging the highest high and lowest low of 52 days and plotting it 26 periods ahead.
The standard line is the trend identifier. When the price breaks above it, the onset of an uptrend is signalled and when it breaks out below the standard line, a downtrend is said to begin. The two lines of the Senkou Span work as dynamic support and resistance levels. So, if the price breaks above, the lower one is the first resistance level and the higher one is the second. If the price breaks out below the standard line, the higher one is the first resistance level and the lower one the second support level.
The Tenkan Sen or the turning line is used to confirm a trend. When it follows the direction of the trend, it confirms the trend, and if it doesn’t, the signal may be false and the market might be ranging.
- Average Directional Index (ADX)
ADX is a trend-indicating oscillator. It oscillates between 0 and 100 to signal the strength of a trend. It helps traders steer clear of false signals. However, it does not indicate the trend direction.
The ADX calculation involves identifying the true range (TR) and directional movement (DM) of the price. Finally, the periodic values are smoothened out by dividing the 14-day smoothened DM by the 14-day smoothened TR and multiplying the result by 100. The same is done for +DM and -DM. Finally, DMI is calculated by dividing the difference between the two by their sum.
A value above 50 indicates a strong trend and a value below 20 indicates a weak trend.
The good thing is you don’t need to do any of these calculations manually. The best online trading platforms provide all these indicators readily applicable on price charts. In most cases, the timeframe for each indicator is adjustable.
A Few Things to Remember While Trend Trading
- The timeframe of an indicator can have a huge impact on the apparent trend and trading strategy.
- A bull market has higher highs, while a bearish one has lower lows.
- A ranging market has highs and lows within the support and resistance levels.
- Experienced traders verify a signal from one indicator with another to confirm and solidify your trading decision.
Experienced traders also test their trend trading strategy with their preferred trend indicators on a demo account before using it on the live markets.
Disclaimer:
All data, information and materials are published and provided “as is” solely for informational purposes only, and is not intended nor should be considered, in any way, as investment advice, recommendations, and/or suggestions for performing any actions with financial instruments. The information and opinions presented do not take into account any particular individual’s investment objectives, financial situation or needs, and hence does not constitute as an advice or a recommendation with respect to any investment product. All investors should seek advice from certified financial advisors based on their unique situation before making any investment decisions in accordance to their personal risk appetite. Blackwell Global endeavours to ensure that the information provided is complete and correct, but make no representation as to the actuality, accuracy or completeness of the information. Information, data and opinions may change without notice and Blackwell Global is not obliged to update on the changes. The opinions and views expressed are solely those of the authors and analysts and do not necessarily represent that of Blackwell Global or its management, shareholders, and affiliates. Any projections or views of the market provided may not prove to be accurate. Past performance is not necessarily an indicative of future performance. Blackwell Global assumes no liability for any loss arising directly or indirectly from use of or reliance on such information herein contained. Reproduction of this information, in whole or in part, is not permitted.

