

How Trend Traders Use Continuation Patterns to Profit
Trend trading is one of the most popular forex strategies. Scalpers, intraday traders, high-frequency traders, daily traders, and even long-term traders aim to ride trends to take advantage of rising or falling markets. What is key when riding a trend is to identify the exit point before the trend reverses, as this helps preserve gains and minimise losses. Trend traders use continuation patterns to hold their positions and accumulate profits.
Technical Analysis for Trend Traders
Analysts at Morgan Stanley projected gold prices to soar above $2,600 by the fourth quarter of 2024. The continued uptrend and bullish forecast can help long-term traders. However, most forecasts by economists and analysts do not give any indication of how XAU/USD might move during a trading session or even a week. This is why trend traders use chart patterns and technical analysis to make trading decisions.
The markets fluctuate through the day. Traders would not like to exit a winning trade too early and forego profits. This is where continuation patterns help. Traders observe price trendlines to discover signals that confirm that an ongoing trend will be sustained. For those traders who missed entering the market at the onset of a trend can rely on continuation patterns to indicate whether it is already too late or they still have an opportunity to take advantage of the market movement. Here are some common continuation patterns.
Triangles
Triangles are formed when the trendlines across peaks and valleys formed by the price-line converge. Three types of triangles indicate the continuation of different types of trends.
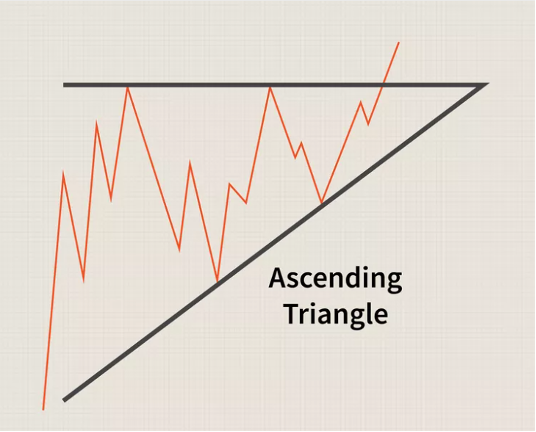
- Ascending Triangle
It indicates that an ongoing uptrend will continue. An ascending triangle is formed when the top trendline (resistance) is relatively flat and the bottom trendline (support) is ascending. Higher lows signal the entry of bullish traders, which pushes the price for a breakout above the resistance. Traders reinforce or continue to hold their long positions.
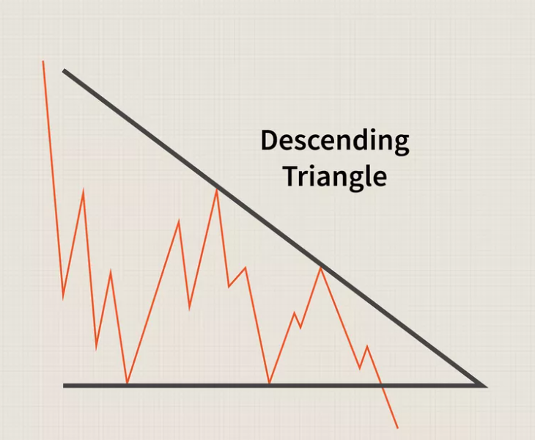
- Descending Triangle
When a bearish trend is poised to continue, the price forms a descending triangle. The support or the lower trendline is relatively flat. The resistance line appears to be converging towards the support. A descending triangle indicates that the price is consolidating towards the resistance and may fall further. This is a time for bears to hold their short positions.
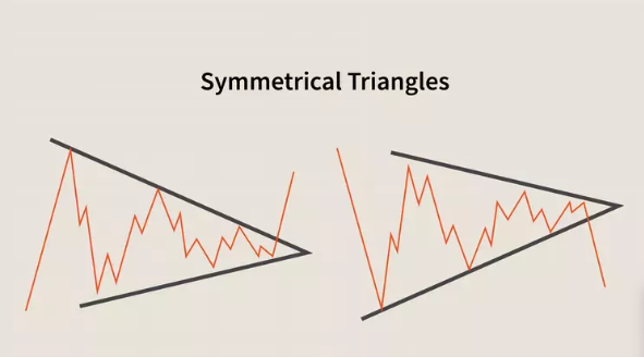
- Symmetrical Triangle
A symmetrical triangle in a range-bound market indicates that the price may continue within the range. However, under certain circumstances, such as an economic data release, central bank announcement or geopolitical news update, this may indicate a breakout in either of the directions. Traders always confirm signals with other technical analysis techniques, such as technical indicators or other chart patterns, to make well-informed trading decisions. This is because there may be a false positive, as no signal is 100% foolproof.
The price target in triangle patterns is the point of breakout +/- the thickest part of the triangle.
Rectangles
Rectangles are formed with parallel support and resistance lines that run flat across the price chart. These are also called consolidation zones or trading ranges.
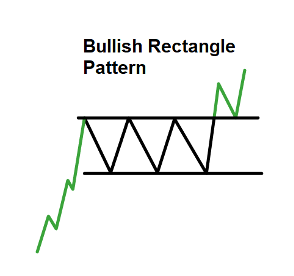
- Bullish Rectangle
A bullish rectangle occurs in an upward moving market and indicates a temporary pause in an ongoing trend. The target price is above the upward swing before the triangle.
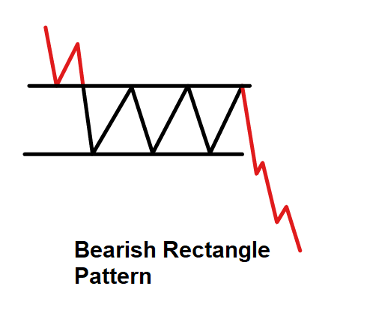
- Bearish Rectangle
Bearish rectangles occur during ongoing downtrends. These work similar to bullish triangles in the opposite direction and signal entry points for trades going short.
Flag Patterns
Flag patterns are short-term continuation patterns that occur in an ongoing trend. Flags are usually followed by a price breakout in the direction of the trend after a small period of consolidation of about 5 to 20 candlestick bars. During the consolidation period, the price moves within a channel that may be parallel or inclined upward or downward. The direction of the flag is not very significant.
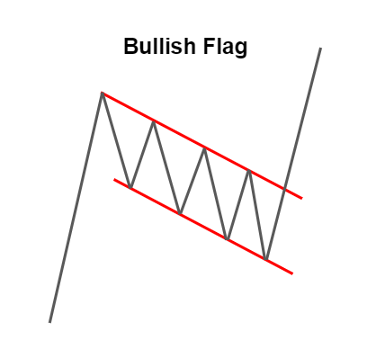
- Bullish Flag
During an uptrend, a bullish flag occurs after a sharp rise in the price of an asset. The price consolidates in a narrow channel between resistance and support levels. It is a signal for trend traders to enter and take long positions. The price target of breakout after a bullish flag is about the length of the flagpole minus the width of the flag above the resistance line.
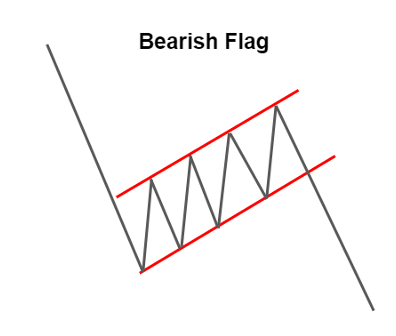
- Bearish Flag
A bearish flag appears in a declining market after a large downward price swing. Traders enter short positions after confirmation of trend continuation as the price breaks below the support. The target price is the length of the flagpole minus the height of the flag below the support level.
A Word of Caution
The biggest challenge trend traders face is failed breakouts. It happens when the price breaks out of the rectangle, triangle, or flag for a short swing and reverses before hitting the target. Such situations lead to losses. Experienced traders always use supporting technical indicators to confirm a breakout before making trading decisions. Additionally, using risk management techniques is of utmost importance. A good practice is to carefully set take profit and stop loss or trailing stop loss orders to minimise losses when the market moves unexpectedly.
To Sum Up
- Trend continuation patterns indicate that market forces can sustain the trend.
- Traders use continuation patterns to ride the trend.
- Triangles, Rectangles, and Flags are the most popular continuation patterns.
- Risk management is important to protect the portfolio against unexpected market movements.
Disclaimer:
All data, information and materials are published and provided “as is” solely for informational purposes only, and is not intended nor should be considered, in any way, as investment advice, recommendations, and/or suggestions for performing any actions with financial instruments. The information and opinions presented do not take into account any particular individual’s investment objectives, financial situation or needs, and hence does not constitute as an advice or a recommendation with respect to any investment product. All investors should seek advice from certified financial advisors based on their unique situation before making any investment decisions in accordance to their personal risk appetite. Blackwell Global endeavours to ensure that the information provided is complete and correct, but make no representation as to the actuality, accuracy or completeness of the information. Information, data and opinions may change without notice and Blackwell Global is not obliged to update on the changes. The opinions and views expressed are solely those of the authors and analysts and do not necessarily represent that of Blackwell Global or its management, shareholders, and affiliates. Any projections or views of the market provided may not prove to be accurate. Past performance is not necessarily an indicative of future performance. Blackwell Global assumes no liability for any loss arising directly or indirectly from use of or reliance on such information here in contained. Reproduction of this information, in whole or in part, is not permitted.


