

Uncover the Correlation between the Nasdaq and Yen

For the longest time, the US markets have been considered largely insulated from events happening in the rest of the world. However, traders have also long looked for patterns to find correlations among assets and create trading strategies. The tech sell-off, accompanied by the strength in the Japanese yen Q3 2024, triggered conversations around the relationship between the Nasdaq 100 and the USD/JPY forex pair. And on a broader scale, it sparked interest in whether the US markets were really immune to global events after all. Discover what happened and how it may impact forex and index trading.
An Emerging Negative Correlation
Between July 6 and August 5, 2024, the gopher (USD/JPY pair) and Nasdaq 100 moved similarly. While the Nasdaq 100 shed over 2,500 points, the USD/JPY declined by 16.12 points. This sparked conversations about the yen being negatively correlated with the US stock market.
Several factors contributed to the apparent correlation between the two.
BoJ Indicated Further Monetary Easing
After eight years of negative interest rates, the Bank of Japan (BoJ) hiked interest rates for the first time in March 2024. Kazuo Ueda, governor of the BoJ, informed that unless inflation reaches the 2% target, the central bank may continue interest rate hikes. Through April and May, the BoJ observed the yen’s performance. The June core consumer price index (CPI) rose 2.1% year on year, surpassing the forecasts of 2% and the previous month’s level by 0.2%. The rising inflation was accompanied by weakness in the yen, which had registered the steepest decline since 1986, hitting ¥160.80 per $1.
According to Masato Kanda, vice finance minister and Japan’s top currency diplomat, the central bank was seriously concerned about the depreciating yen. He mentioned that the BoJ was closely monitoring market trends and would act promptly to prevent any excessive decline. Kazuo Ueda had also expressed a commitment to normalising inflation and bringing it to a range of around 2%, much like the target of most developed economies.
This intensified the hawkish stance of the BoJ, and traders weighed in on another interest rate hike in Japan following the July meeting of the central bank. The positive sentiment towards the currency supported the upward trend of the JPY against the USD.
Poor Tech Sector Performance
Broader technology sector earnings for Q2 2024 were lacklustre, triggering a tech stock sell-off in the last week of July 2024.
Usually, traders borrow JPY, leveraging the negative interest rate, and invest in US indices or growth stocks to capitalise on a potential uptrend. However, the poor performance of the technology sector and the yen’s strength further deepened the dent in the performance of the Nasdaq 100. This highlighted the correlation between the two assets. Other benchmark indices faced a similar situation. On July 25, 2024, the S&P 500 had its worst day in 18 months, losing 2.3%. The Nasdaq Composite index declined 3.6%, registering the worst loss since October 2022 on the same day.
A Broader View of the Correlation
Donald Trump is known for his pro-business policies. He has chosen Sriram Krishnan as his AI-policy advisor. This has fuelled positive sentiment for the US stock market, especially AI stocks, leading the Nasdaq 100 to add 0.5% in December 2024.
After Trump won the US presidential election in November 2025, BoJ Governor Ueda expressed caution in raising interest rates. The BoJ wanted to observe how Trump’s second term as president unfolds before raising interest rates any further. Additionally, the Fed lowered interest rates by another 0.25%, which increased the interest rate differential between the US dollar and Japanese yen. This and speculations of delayed interest rate hikes by the BoJ weighed on the JPY and the USD/JPY rose nearly 5% in the last month of 2024.
By January 7, 2024, the yen had hit another 6-month low and the BoJ warned investors about making informed decisions, while the bank would take necessary steps to prevent large downswings.
Notably, this is not a momentary glitch. The tech-heavy Nasdaq and the USD/JPY have demonstrated a continued correlation since late 2022. See the performance below:
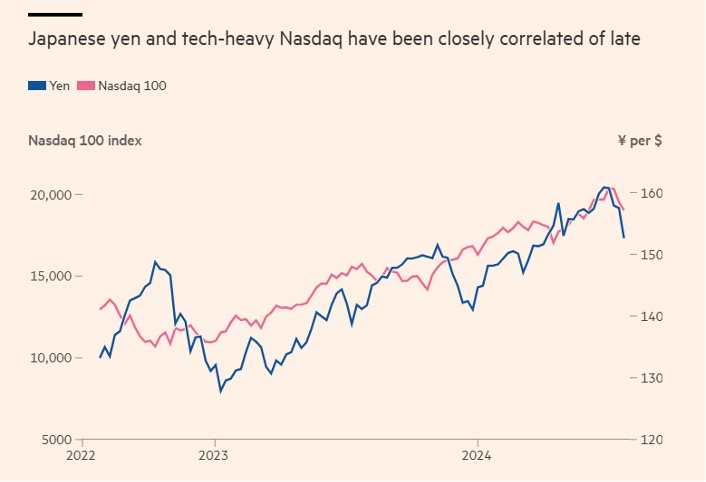
Source: Financial Times
Trading the Continued Correlation
The Japanese yen, which had been declining against the US dollar since 2022, switched directions in 2024. Traders expected the yen to remain weak, largely because the US economy was performing well, providing tailwinds to the USD. This had also kept the Fed from deepening its interest rate cuts. The one-way street of the yen became a two-way one, creating more uncertainty and volatility around the Japanese currency.
At the same time, mega-cap tech stocks fell across the world, with European indices losing steam due to the poor tech sector performance. However, small caps rose, creating new opportunities for traders. In such times of uncertainty, opportunities arise in both directions, and traders gravitate towards instruments that enable them to open positions in rising and falling markets.
Derivatives, such as contracts for difference (CFDs) are among the most popular instruments to take advantage of market moves in either direction and hedge against price movement surprises. CFDs are traded on margin, which amplifies your purchasing power, translating into higher profit but also higher loss exposure. Therefore, risk management is paramount while trading with derivative instruments, such as CFDs.
To Sum Up
- The Nasdaq 100 and JPY seem to be developing a negative correlation.
- The BoJ’s decision to raise interest rates has triggered upside momentum in the Japanese currency.
- USD/JPY and index traders must refine their strategies based on whether the JPY is rising or declining against the greenback.
- Using CFDs allows traders to take advantage of opportunities in both rising and falling markets.
- Risk management is paramount while using derivative instruments, such as CFDs.
Disclaimer:
All data, information and materials are published and provided “as is” solely for informational purposes only, and is not intended nor should be considered, in any way, as investment advice, recommendations, and/or suggestions for performing any actions with financial instruments. The information and opinions presented do not take into account any particular individual’s investment objectives, financial situation or needs, and hence does not constitute as an advice or a recommendation with respect to any investment product. All investors should seek advice from certified financial advisors based on their unique situation before making any investment decisions in accordance to their personal risk appetite. Blackwell Global endeavours to ensure that the information provided is complete and correct, but make no representation as to the actuality, accuracy or completeness of the information. Information, data and opinions may change without notice and Blackwell Global is not obliged to update on the changes. The opinions and views expressed are solely those of the authors and analysts and do not necessarily represent that of Blackwell Global or its management, shareholders, and affiliates. Any projections or views of the market provided may not prove to be accurate. Past performance is not necessarily an indicative of future performance. Blackwell Global assumes no liability for any loss arising directly or indirectly from use of or reliance on such information here in contained. Reproduction of this information, in whole or in part, is not permitted.

