Importance of Japanese Candlesticks in Technical Analysis

Japanese candlestick charts were created with the aim of showing a significant relationship between market prices and supply & demand of commodities. Today, these charts are used in trading all kinds of financial instruments, by helping traders judge market sentiment.
There are two groups of traders in the market, buyers and sellers. Candlestick patterns provide a way to understand which of these groups currently controls the price action. This information is visually represented in the form of different colours on these charts. Apart from market psychology, candlesticks also represent high, low, opening and closing prices of a financial instrument, for a certain time period. They are one of the most useful technical analysis tools available to modern traders.
Anatomy of a Candlestick Bar
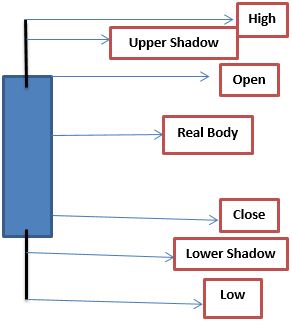
As the name suggest, these bars have the appearance of candlesticks, with an upper wick (upper shadow), lower wick (lower shadow) and a real body. The price high is represented by the top-most part of the upper shadow, while the low is marked by the bottom part of the lower shadow. The body can be either hollow or filled with a colour.

The real body represents the difference between the open and close prices for the day. The above figure is a representation of a filled candle, where the closing price was lower than the opening price.
Long shadows or wicks, as they are called, could indicate that trading continued way past the open and close values, while short shadows show that a major portion of the trading took place near the open and close prices.
Filled Body Candlestick
In the above image, the body is filled with colour. Traders can customise the colours on their trading platform. Filled body patterns are formed when the trading instrument closes at a price lower than the opening price. The bottom of the body shows the closing price and the top portion represents the opening price of the instrument. When the price closes lower than the opening price, it indicates a bearish candle or that the sellers are in control of the price action.
Hollow Body Candlestick
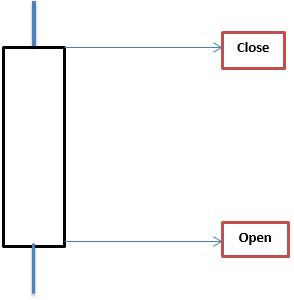
If the trading instrument closes at a price higher than its opening price, a hollow/white bodied candlestick is formed on the chart. Here, the bottom of the body shows the open price, while the top portion shows the closing price. This means that buyers are in control of market prices, as the prices close above the opening price, representing a bullish candle.

As mentioned before, traders can choose the colours of their down and up candles. White bodied or hollow candles are often coloured green. The sizes of the bodies also depict buying and selling pressure. The longer the candlestick body, the greater the price momentum is likely to be in a particular direction. For instance, a longer bullish candlestick indicates greater buying pressure, as compared to selling pressure, for that particular time period. Similarly, a longer bearish candlestick means greater selling pressure in the market.
The different shapes, sizes and colours of the candles represent market psychology, which could be highly useful in predicting future price trends.
Analyzing Market Sentiment with Candlesticks
When an instrument’s price closes at the top of the price range, it indicates the presence of aggressive buyers, who are willing to get any price to get a piece of the action. At the same time, sellers are willing to sell only at higher prices, which causes the asset price to move up.
In cases where the price closes at the bottom of the price range, it signals the presence of aggressive sellers, who are willing to exit trades at any price. Since buyers are only willing to buy at lower prices, the asset price moves down.
Where an instrument closes, with respect to the price range, is important for traders to know, in order to understand who are in control of the price action.
Candlesticks can also be classified into wide-range candles and narrow-range candles. Wide-ranged candles indicate a higher interest in a particular asset, which will be represented in the form of higher volatility. Narrow-range candles depict lower volatility, indicating lower interest in trading the asset.
If the asset price is moving in the direction of wide-range candles, traders can study the charts to gauge the interest of buyers and sellers, and then choose whether they wish to trade. If they do decide to trade, it usually is in the direction of the trend. Narrow-range candles represent low volatility, which could mean that the price will reverse soon (up or down).
Doji Candlestick
This is a type of candlestick pattern without a defined body, where the opening and closing price are more or less at the same level (with a difference of just a few pips). It doesn’t represent significant buying or selling pressure in any direction, indicating an indecisive market. If such candlesticks are seen at the end of a large price movement, they could indicate a significant reversal.

Benefits of Using Candlestick Patterns
So far, we’ve talked about some basics of candlestick formations. Candlesticks can come together to form various patterns, telling a trader about the market sentiment and price trends. They are great tools to ascertain the profit potential and market risks involved. Some of the key benefits of using candlesticks include:
- Patterns are easy to identify and comprehend, if one makes a little effort to study them.
- Compared to traditional charts, they provide more information regarding the interaction between buyers and sellers during a specific timeframe. The bearish and bullish engulfing patterns can provide a lot of information on market sentiment.
- One can identify whether the market is bearish or bullish, with a single glance at the colours and lengths of the candlesticks. Such information might not be readily available in other charts.
- They can identify market turning points and also the direction of the trend.
Japanese candlesticks can be used for various assets, such as forex, stocks or indices, as well as in conjunction with many other technical indicators, such as Bollinger Bands or Pivot Points.


