
Trade Smarter. Access Everything.
Access the world's financial markets with Blackwell.
Trade major global markets
Multi asset trading with a single account.
Forex
Trade 50+ forex pairs with tight spreads and fast execution.
Commodities
Trade commodities with deep liquidity and consistent pricing.
Indices
Trade major global indices with competitive spreads and reliable execution.
Equities & ETFs
Trade global equities, ETFs and fixed income products.

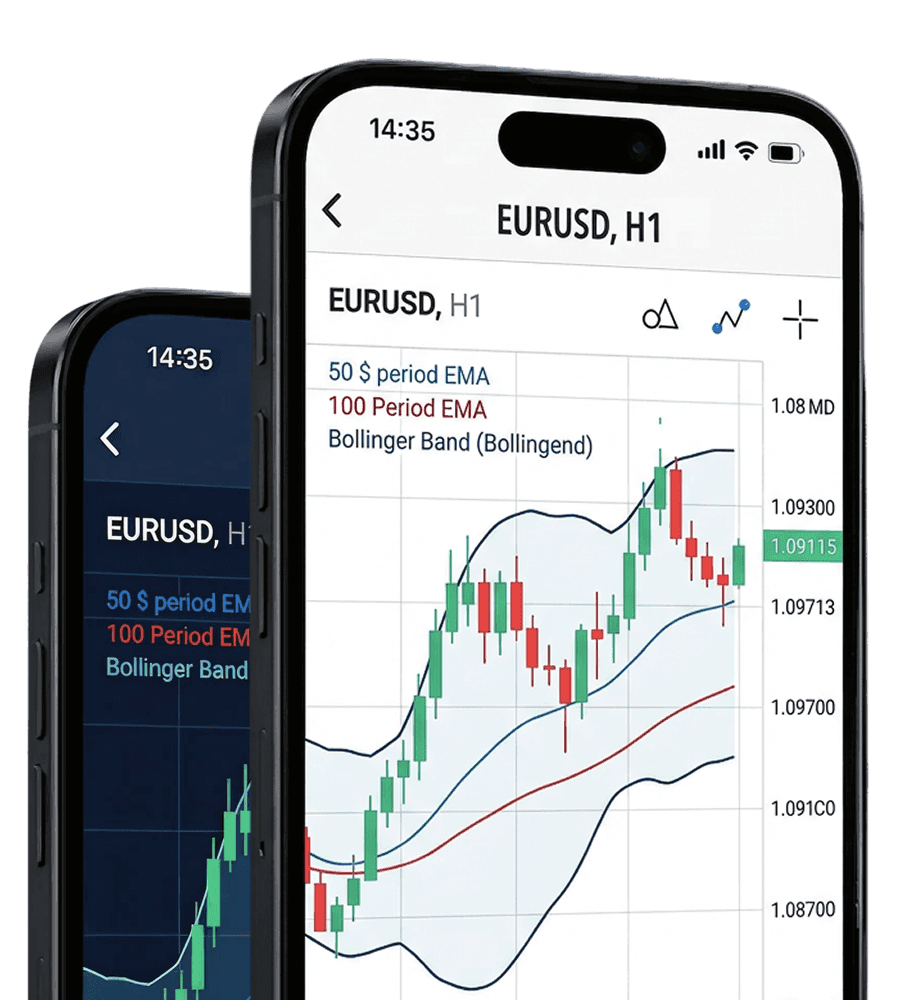
Trade on industry leading platforms
MT5 and Blackwell Trader give you everything you need to trade efficiently, from advanced charting to fast execution, across desktop and mobile.
Open Account20 years of industry excellence
Blackwell combines global regulation, deep infrastructure, and global financial market access to clients worldwide.

20+ years of industry presence
Since 2003 we've been offering our traders premium trading conditions.

Institutional-grade infrastructure
Execution supported by interbank liquidity and DMA market access.

Transparent pricing
Clear pricing across asset classes with no hidden costs.

Global market access
Trade forex, indices, commodities, metals, and equities from a single platform.
Trusted. Secure. Global.
Built on decades of industry experience, Blackwell has established a brand as a leading financial services provider, with trusted client relationships across the world.


Leading standard of excellence
A brand built on trust. Blackwell is proud to say our customer service and reliability is second to none.