

A Brief Introduction to Channel Trading
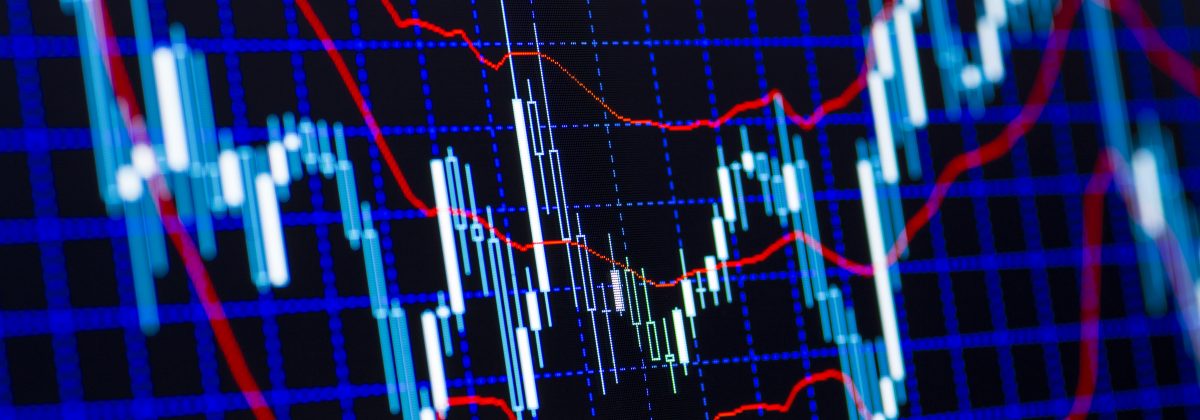
Price action traders utilise patterns formed on their charts through the movement of currency prices to make trading decisions. The channel pattern is an effective technical analysis tool to determine good positions to buy and sell. Trading channels can be constructed on charts by graphing two trendlines at the support and resistance levels. So, consider it as an area between two parallel trendlines; where the upper trendline is the resistance line and the lower one, the support line.
What are Trend Channels?
The prevailing direction of price can be shown by plotting lines over pivot highs or lines below pivot lows; these are called trend lines. The resistance line (or the upper trendline) is seen by plotting lines connecting price highs. Similarly, the support line is constructed by connecting the price lows.
Both price highs and lows are the extreme levels that prices reach, before reversing in the opposite direction. Channels are formed when currency prices stay constant between these levels for some time. Channel trading is mostly suitable for short-term and medium-term trading. Trend channels are not used for long-term trading, since they cannot flow through reversals. They depend largely on the currency’s trend cycle; covering exhaustion gaps, break-out gaps and runaway gaps.
Trend channels can be broadly classified into three categories; ascending channels, descending channels and flat channels.
1. Flat Channels
Also called horizontal channels, flat channels are formed through horizontal highs and lows. In this case, trendlines have no slope. They signify sideways movement in the market, without an uptrend or downtrend. Flat channels are also sometimes referred to as sideways price channels.
Flat channels tell us that channels are not only for trending markets. In such channels, trades can be done without any directional bias. We can buy at the bottom and sell short at the top. The Gimmee Bar Strategy is a classic trade pattern meant for such sideways markets. In this case, Bollinger Bands act as channels.
· Gimmee Bar Long Trading Strategy
For starters, the price has to keep on falling within a range and tag the lower Bollinger Band. Then, you have to wait for the bar that closes at a higher level than the open. This is the Gimmee Bar. Now, you could buy 1 tick above this bar.
· Gimmee Bar Short Trading Strategy
In this strategy, the price has to keep rising within a range and must tag the higher Bollinger Band. The bar that closes lower than the open is the Gimmee Bar. Then proceed to sell 1 tick below the bar.
2. Ascending Channels
These channels normally have higher highs and lower lows. They are drawn with two lines with positive slopes at the support and resistance levels of a chart. Ascending channels generally show bullish trends.
3. Descending Channels
The opposite of ascending channels, descending channels are formed by two trend lines with negative slopes at the support and resistance levels. They would usually have lower highs and lower lows. They show bearish trends in the market.
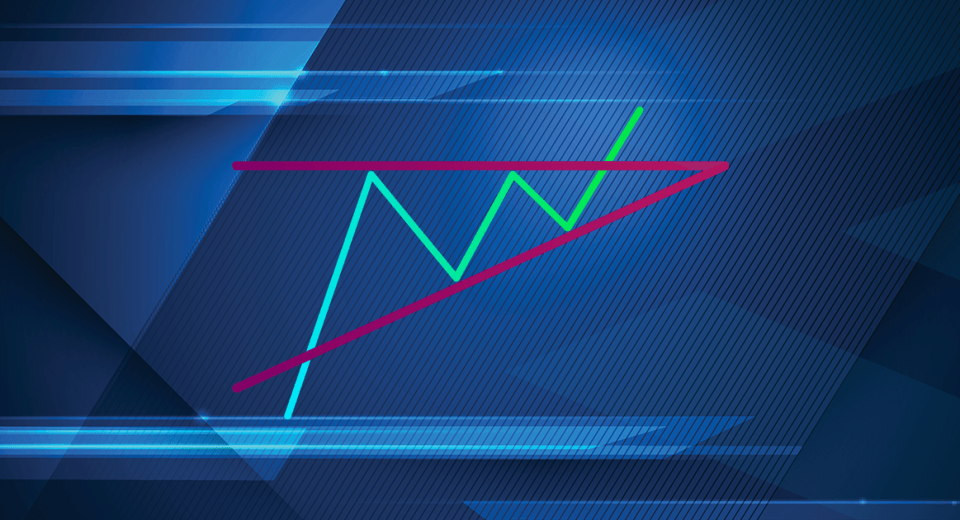
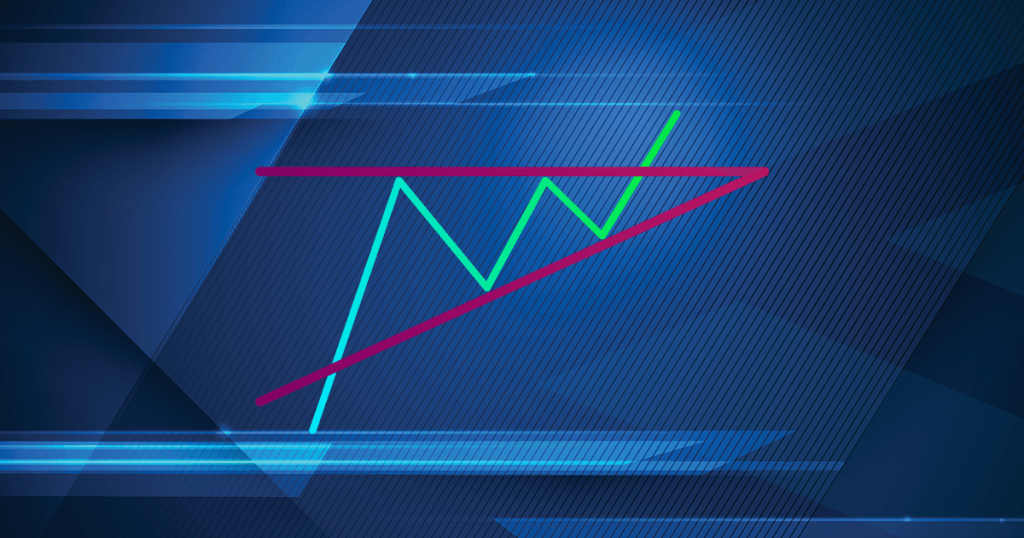
Trading Trending Channels
Think of these channels just as horizontal channels being turned at angles. The angular channels make higher highs (ascending) or lower lows (descending) with the ongoing price action on the charts. Irrespective of which channel you are trading, it is always wise to buy close to the lower trend line (support line) and then wait for the price to reach the upper trend line (resistance line) in order to take profit.
But remember that in order to trade trending channels, you need to confirm that the slopes are at healthy angles that show that the markets are indeed trending. Also, it is always a good idea to keep the stop-losses in place, since we don’t exactly know when these levels get broken. Experts suggest that the price at the first “low of the lower trend line” should be kept as the stop-loss point. Alternatively, you can also place it at a slightly lower level than that.
After you take profit at the resistance level, a sell position can be entered close to the upper trend line.
What are Envelope Channels?
This category of channels is drawn taking into account longer term price movements. They include trend lines that are constructed on the basis of statistical levels. Bollinger Bands and Donchian channels are two examples of envelope channels.
1. Donchian Channels
Donchian channels were created by Richard Donchian to function like an MACD indicator and resemble other channel indicators, like Bollinger Bands. It simply plots the highest highs and lowest lows of the last “n” periods. This period can be chosen by traders according to their strategy’s timeframe.
Donchian channels are primarily used for looking at volatility in the markets. When price fluctuations are heavy, the channels are wider and vice versa. Generally, the 20-period Donchian channel is used by traders in default settings. Traders take long positions if the currencies are trading higher than the Donchian channel’s “n” period level, and take profit if they are trading below it.
There is a middle band in Donchian channels that can be used as a breakout indicator. Trader can open a long position if prices rise above this level and go short if prices go down. Combining these channels with other indicators, like stochastic oscillators, MACD or volume oscillators, can give more accurate entry/exit signals.
2. Bollinger Bands
Another popular channel that works on moving average trend lines is Bollinger Bands. The trend lines at the support and resistance levels depend on the movement of moving averages. Usually, two standard deviations above the moving average is the resistance line, and two below is the support line, but these levels can be customised according to the needs of the trader.
Since standard deviation is a measure of volatility, these bands widen with an increase in price fluctuations and shrink with lower fluctuations. Traders consider that the more the price moves towards the upper band, the more overbought the market will be. On the other hand, the more it moves downwards, the more oversold the market is.
Lower volatility brings the bands closer to each other, which is termed as “squeeze.” Squeeze signals signal future volatility and trade opportunities for traders. However, these movements do not tell when the breakouts will occur or when the volatility will change. Even the breakouts cannot tell traders whether to buy or sell.
Disclaimer
If you liked this educational article please consult our Risk Disclosure Notice before starting to trade. Trading leveraged products involves a high level of risk. You may lose more than invested capital.
