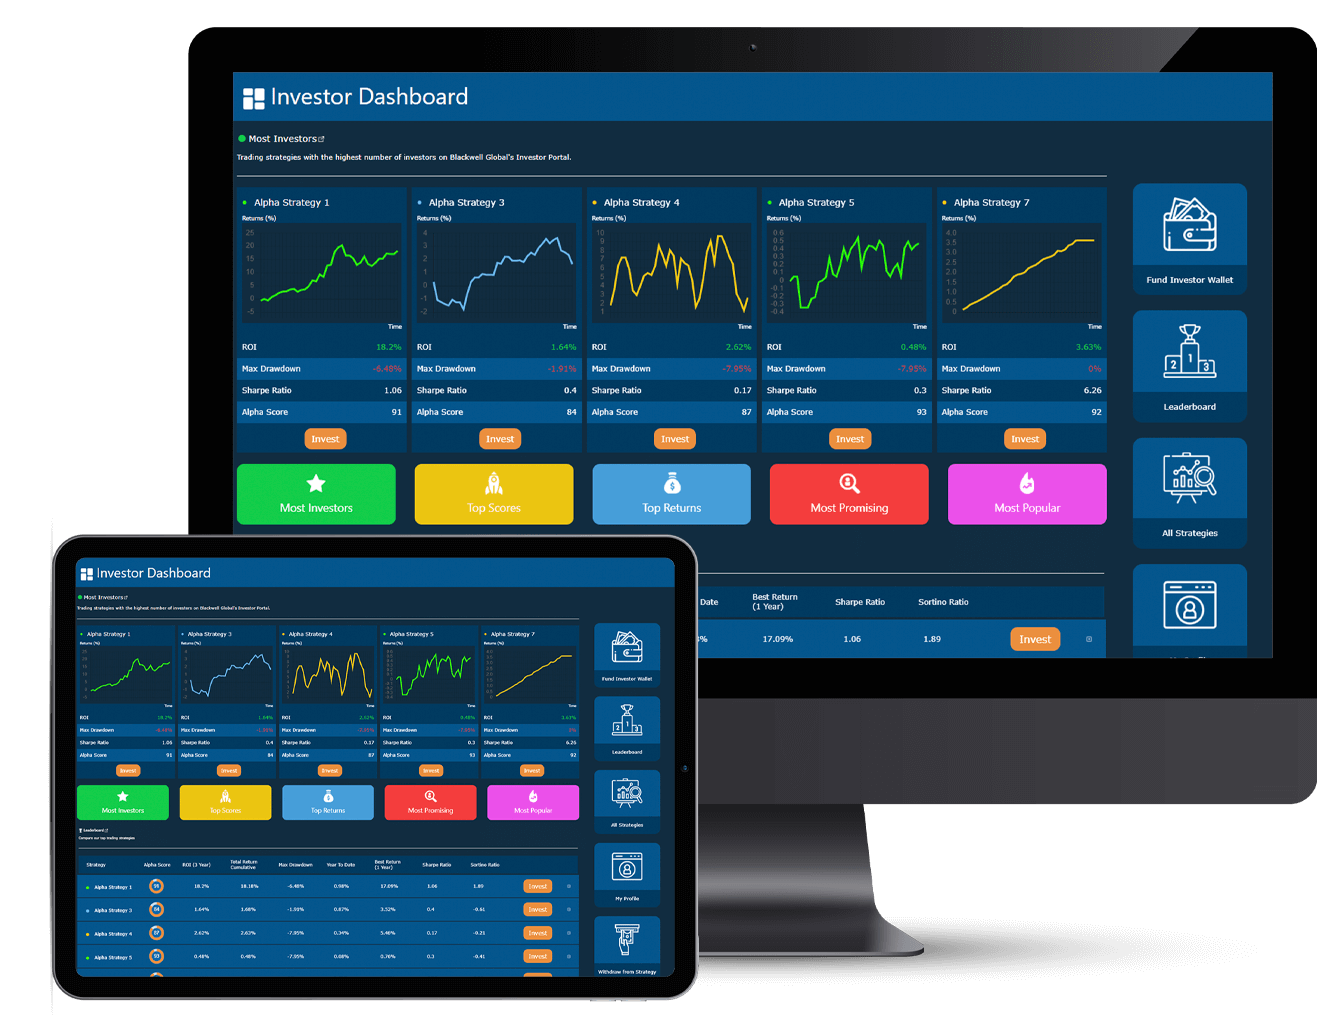
Start Building your Portfolio and Meet your Investment Goals Today
Blackwell Global Investments provides a solution to investors who are attracted to the potential of the markets but don't necessarily have the time to trade themselves.
Become an Alternative Investor and select the trading strategies you wish to invest in. Gain access to our Investor Portal, start building your portfolio and seamlessly allocate and move capital between your selected strategies.
Our Promise to Investors
We believe investors should only pay for success, so you will only ever pay on the profits you make
Our Promise to Investors
We believe investors should only pay for success, so you will only ever pay on the profits you make
No Joining Fees

YOU DO NOT PAY ANY FEES TO JOIN
There are no management fees or entry fees to start investing with us. You also will not have any lockup periods to exit any investments.
Performance Fee Only Model

PAY ONLY WHEN YOU PROFIT
Our traders charge a performance fee of 20% for any of the profits achieved by you - meaning you keep 80% of any profits made.
Transparent Profit Calculation

HIGH WATER MARK FEE CALCULATION
Profits are calculated using the High Watermark Approach (HWA), meaning that incentive fees are paid only when your account value is higher than the previous month.
How to get Started
How to get Started
Sign up

Register with Blackwell Global Investments to gain access to our investor portal
Deposit Funds

Fund your account using a range of methods. All investor capital is held securely with tier 1 trusted banks
Invest and Build your Portfolio

Select the available trading strategies you like and allocate your capital across multiple strategies to build your investment portfolio
Available Investment Strategies
Profits made are subject to performance fees
Monthly Performance
Performance Table
| Year | JAN | FEB | MAR | APR | MAY | JUN | JUL | AUG | SEP | OCT | NOV | DEC | Total |
| 2019 | 1.56% | 1.66% | 5.23% | 1.97% | 1.84% | 1.48% | 1.70% | 7.97% | 4.02% | 0.38% | 0.77% | 1.22% | 33.97 |
| 2020 | 2.25% | 2.31% | 43.15% | 12.60% | 2.23% | 3.68% | 0.26% | 4.43% | 2.28% | 1.19% | 2.40% | 0.21% | 98.86% |
| 2021 | 9.87% | 2.50% | 1.49% | 0.29% | 0.14% | 3.72% | 1.09% | 0.63% | 0.38% | 1.11% | 2.07% | 2.07% | 28.13% |
Time weighted monthly returns
Monthly Performance
Performance Table
| Year | JAN | FEB | MAR | APR | MAY | JUN | JUL | AUG | SEP | OCT | NOV | DEC | Total |
| 2019 | 12.09% | 12.28% | 16.61% | 8.05% | -8.60% | 1.54% | -3.02% | 0.68% | -20.19% | 25.41% | -8.12% | -11.43% | 17.03 |
| 2020 | -10.64% | 25.42% | 64.26% | 26.46% | -11.21% | -21.87% | -29.89% | 12.28% | 14.09% | 22.65% | 0.79% | 28.32% | 130.05 |
| 2021 | -5.07% | -6.86% | 5.78% | 4.04% | -20.69% | -4.02% | -15.63% | 18.74% | 6.85% | 1.10% | 0 | 0 | -20.37% |
Time weighted monthly returns
Monthly Performance
Performance Table
| Year | JAN | FEB | MAR | APR | MAY | JUN | JUL | AUG | SEP | OCT | NOV | DEC | Total |
| 2019 | 3.22% | 0.21% | 1.61% | 1.01% | 1.70% | 1.92% | 2.05% | 2.02% | 2.12% | 1.72% | 0.82% | 0.97% | 21.22% |
| 2020 | 1.33% | 2.54% | 3.50% | 5.56% | 5.42% | 4.58% | 2.54% | 0 | 1.31% | 3.20% | 2.12% | 0.15% | 37.30% |
| 2021 | 0 | 2.81% | 1.11% | 1.61% | 2.90% | 3.62% | 2.66% | 1.13% | 1.47% | -0.17% | 0.87% | 0 | 19.51% |
Time weighted monthly returns
Monthly Performance
Performance Table
| Year | JAN | FEB | MAR | APR | MAY | JUN | JUL | AUG | SEP | OCT | NOV | DEC | Total |
| 2019 | -0.24% | 0 | 1.81% | 0 | 0.37% | 3.11% | 0.18% | 0.65% | 2.18% | 0.65% | 0 | 1.79% | 10.99% |
| 2020 | 0 | 1.50% | 14.68% | 0.09% | 0.16% | 1.33% | 0 | 0.55% | 0.76% | 0 | 0.09% | 0.28% | 20.30% |
| 2021 | 0.52% | 0 | -0.29% | 1.49% | 2.06% | 1.66% | 0.55% | 1.68% | 0.56% | 0 | 0.28% | 0.37% | 9.24% |
Time weighted monthly returns

