

Differences between Standard Deviation and Z Score
Forex trading is a highly volatile activity that can yield good results if traders invest wisely and base their decisions on fundamental or technical analysis, which are in turn based on established mathematical tools. Probability and statistics are the key to developing, testing and succeeding in forex trading, which makes it crucial for traders to know about them.
As well as knowing what concepts like Standard Deviation and Z Score mean, traders need to also know how they are calculated, what the differences between them are and where each is best applied.
Here’s the first step to understanding these two important finance fundamentals.
Understanding the Role of Standard Deviation and Z-Score in Identifying Volatility
Standard Deviation basically reflects the amount of variability in a given data set and is calculated by finding the difference between each data point and the mean. These differences are then squared, summed and averaged to produce the variance. The square root of this variance is the standard deviation.
On the other hand, Z-Score is the number of standard deviations a given data point lies away from the mean. This measure is calculated by subtracting the mean from each point and dividing the result by the standard deviation. The Z Score is negative for data points that are below the mean. It has been found that in most large data sets, 99% of the values have a Z Score between -3 and 3, which means they lie within three standard deviations above and below the mean.
Both Standard Deviation and Z Score are highly useful tools for determining market volatility. As the standard deviation increases, it indicates that price action varies widely within the established time frame. Once we know this, we can use the Z-Score of a particular price to find out how typical or atypical this movement is, based on previous performance.
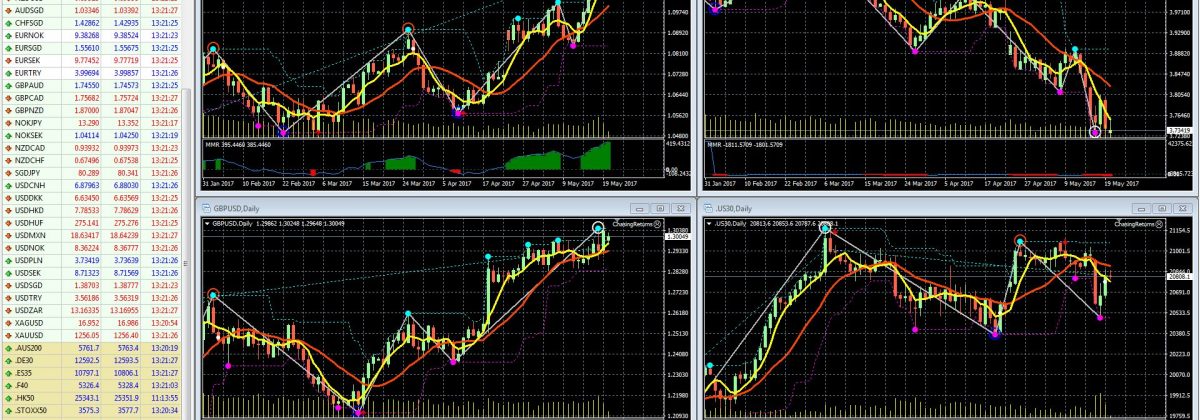
One of the most widely used technical indicators based on standard deviation is Bollinger Bands, which are a visual representation of the Z-Score. For any given price, the number of standard deviations from the mean is reflected by the number of Bollinger Bands between the price and the exponential moving average or EMA.
Applications of These Tools
Dispersion and standard deviation are highly important for managing the risk involved in forex trading. The higher the value of standard deviation, the bigger is the potential drawdown and higher the risk. Similarly, the lower the value of standard deviation, the lower will be the drawdown while trading the system.
Apart from judging the risk associated with a particular trading system, traders can also find out how often profitable trades will occur in relation to losing trades. This can be done by calculating the Z-Score. As mentioned earlier, while a positive Z-score represents a value above the mean, a negative Z-score represents a value below the mean. What one needs to remember is that calculating the Z Score requires that the trader knows the parameters of the population, not merely the characteristics of a sample taken from that population.
Z-Score helps in knowing whether a trading system contains fewer or greater series of winners and losers than expected from a random sequence of trades, or whether the outcome of consecutive trades are dependent upon each other. The score of a sequence of trades may indicate a dependency between the results of those trades. This observed dependency lets the forex trader vary position sizes for individual trades in order to manage risk.
So, in simple terms, standard deviation shows the variability within a given data set, while the Z Score refers to the number of standard deviations a given data point lies from the mean. The Z Score indicator is a supplement to the widely used Bollinger Bands indicator and offers a simple way to assess the position of the price vis-à-vis its resistance and support levels. In addition, crossings of Z Score averages may signal the start or end of a tradable trend.
Disclaimer
If you liked this educational article please consult our Risk Disclosure Notice before starting to trade. Trading leveraged products involves a high level of risk. You may lose more than your invested capital.
