

Everything You Need to Know About the MT4 Awesome Oscillator
MetaTrader 4 (MT4) offers a wide range of technical analysis tools, including 30 in-built technical indicators and access to over 2,000 custom indicators, for traders to analyse all types of market conditions. The great news is that the MT4 Awesome Oscillator (AO) is one of the standard tools included on the platform. It can be found in the Bill Williams category of indicators, named after its famous inventor.
The oscillator wasn’t developed as an individual one, but rather as a part of the Chaos Theory, propagated by technical analyst Bill Williams. The theory stresses on trading psychology as the main driver of the global financial markets. According to Williams, traders who spend too much time on technical and fundamental analysis, lose focus on the real market, which is actually dynamic. It is dependent of factors like space, energy, force and a combination of these aspects.
Williams developed indicators for each of these dimensions, of which the Awesome Oscillator helps identify whether the markets are being driven by bullish or bearish forces. This is done by comparing the current market momentum with the general momentum over a wider frame of reference.
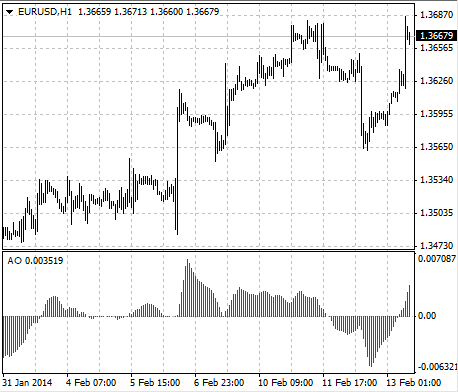
Image Source: https://www.metatrader4.com/en/trading-platform/help/analytics/tech_indicators/awesome_oscillator
How Does It Work?
Technically, a 34-period SMA (simple moving average) is plotted through the middle point of the price bars ((H+L)/2)), and then subtracted from a 5-period SMA line, plotted across the middle point of the bars ((H+L)/2). So, the AO is simply the difference between the moving averages over the two timeframes: the 5-period and the 34-period.
H = Highest price of the bar
L = Lowest price of the bar
The difference is calculated and the value is then plotted as a histogram. Hence, by comparing the price aggregate information over different timeframes, traders can know more about the market condition, which is otherwise not apparent.
When the histogram rises above zero and continues to rise, it indicates that the price momentum is strong. When the same histogram is above the zero line, but starts plotting red histograms of consecutively decreasing heights, it indicates that the price momentum is weakening. In case these price declines become more substantial over time, below the zero line, it means that the momentum of price decline is intensifying.
Typically, in a bullish scenario, the short-term moving average (MA) is above the long-term moving average line. In such cases, the larger the distance between these two MA lines in the uptrend, the higher the histogram rises.
Similarly, in a bearish climate, the short-term MA line is below the long-term MA line, and as the distance between these two lines increases, the histogram tends to make significantly longer bars below the zero line.
The Standard Trading Signals of the Awesome Oscillator
The indicator gives different signals, based on which forex traders can put together an efficient trading strategy.
Zero Line Crossover
This is the simplest and most straightforward signal, mentioned previously. When the AO crosses the zero point, it is a bullish signal, which is usually a sign to enter a long position. When the AO goes below zero level (nought line), a bearish signal showing seller intent is displayed.
- Only two columns of the bars are enough for this signal to be considered
- Simultaneous signals to buy and sell are impossible
- For the transition from negative to positive level case, the first column has to be formed below the zero line.
Saucer Signal
This happens only when the AO is above the nought line, generating a signal to buy.
- AO is above the zero line but temporarily changes momentum, in other words, it changes direction from falling to rising. The second column is positioned lower than the first one and is coloured red. The third column is higher than the second one (indicating a buildup of momentum again) and is coloured green.
- The bar chart should have at least three columns, for this signal to be valid.
- Bullish saucer needs all 3 columns to be above the zero line
- Bearish saucer needs all 3 columns to be below the zero line.
This is similar to price correction behaviour, before it continues on its trend path.
The Twin Peaks Signal or Twin Pikes Signal
Here, traders need to analyse price action and compare it to the AO on a bar-by-bar basis. Two “price peaks” need to be formed on the same side of the zero line.
- A bullish twin peak signal has peaks below the zero line, where the second peak needs to be formed higher than the first peak, followed by a green bar.
- A bearish twin peak signal requires two peaks to be formed above the zero line, where the second peak needs to be lower than the first peak, followed by a red bar.
- Troughs between the two peaks also need to be on the same side of the zero line.
Price and Momentum Divergence
If the market price is making new highs, but the AO indicator fails to follow suit, it indicates bearish divergence. If the price is setting new lows, but the AO indicator doesn’t do so, this indicates bullish divergence. Unlike the three previous signals mentioned above, this is a signal to sell. Here, the AO is being used as a divergence indicator. However, remember that these signals can be inconclusive.
Markets can tend to go higher in a bearish set-up, which is why the AO indicator is used along with other indicators to get stronger trading signals.
Launching Awesome Oscillator on MT4
The AO is one of the standard indicators on the platform, which means that it is right there in the “Navigator” window, ready to be used on opening. There are 4 main categories of indicators on the MT4 platform: Trend, Oscillators, Volumes and Bill Williams.
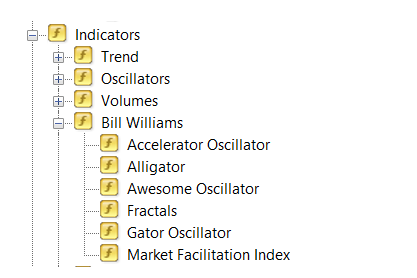
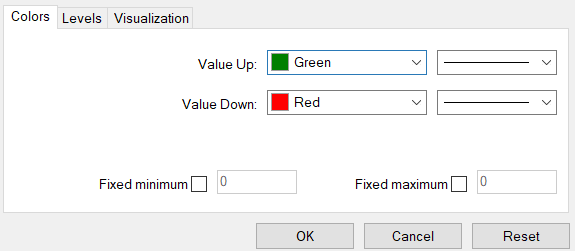
The AO is housed in the “Bill Williams” folder. Traders can modify colours and timeframe visualisation.
The AO indicator definitely provides an edge to traders in making informed decisions. However, when used in isolation, it can produce contradictory signals, which is why other tools are needed to confirm a signal.
Test it on a demo account first, to see whether the indicator is indeed as “awesome” as it sounds.


