

Everything You Need to Know About Support and Resistance Levels

The key support and resistance (S&R) levels serve as entry and exit points for traders and are critical elements of technical analysis. Support is the price level at which an asset has historically found buying pressure and is likely to bounce back up. At resistance, bearish sentiment intensifies, exerting selling pressure, and the price moves back down. These levels are formed when bears and bulls are equally strong, and the market has similar buying and selling pressure.
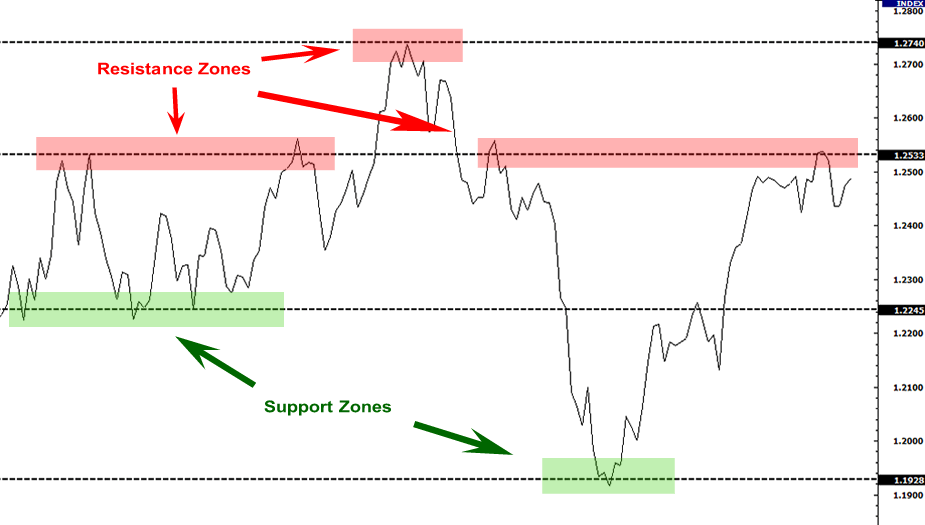
Source: babypips.com
These levels signal the first signs of a change in trend, and traders use these signals to open long or short positions. The strength of the countering and supporting forces determines the longevity of the market in holding the two levels.
A strong trend develops into a rally only if the resistance or support levels are breached with enough volume and momentum. Therefore, range traders monitor volume and momentum to make informed speculations and take strategic positions. For instance, an upward trend sets in when resistance is breached. Strong volume-supported buying may lead to the resistance level becoming a support level for the next leg of the uptrend.
Types of Support and Resistance Levels
Traders can have three types of key levels based on the amount of flexibility they incorporate in their strategy.
Fixed
Fixed S&R levels lose significance as soon as the price breaches either one. Generally, psychological or sentimental limits (often whole numbers) and previously important price points, such as all-time highs or record-breaking lows, are fixed support and resistance levels. Indicators like moving averages and Bollinger Bands are used to plot dynamic S&R levels.
Dynamic
Dynamic support and resistance levels are plotted with the help of technical indicators for a duration relevant to the trading strategy. These levels may change multiple times a day and move with time and price in real time.
Semi-Dynamic
Semi-dynamic S&R levels change with time and price movements at a predetermined rate. Trendlines, Fibonacci retracement, and pivot points are used to plot semi-dynamic key levels for a flexible trading strategy.
Popular Indicators to Identify Support and Resistance Levels
Fibonacci Retracements
Fibonacci retracements highlight key levels in terms of percentages of the Fibonacci ratios between two levels marked as 0 and 1 for the period under consideration. The most commonly used percentages are 23.6, 38.2, 61.8, and 78.6. This indicator enables traders to take advantage of swing highs and swing lows within the chosen range.
Image: Fibonacci Retracement Levels
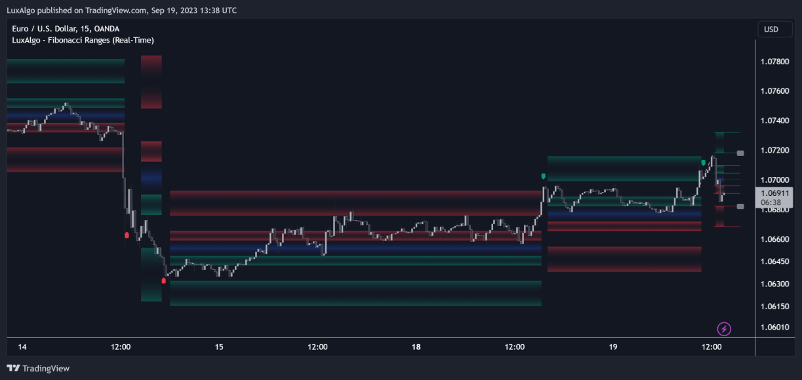
Source: https://www.tradingview.com/x/1YgBfMCp
Camarilla Pivots
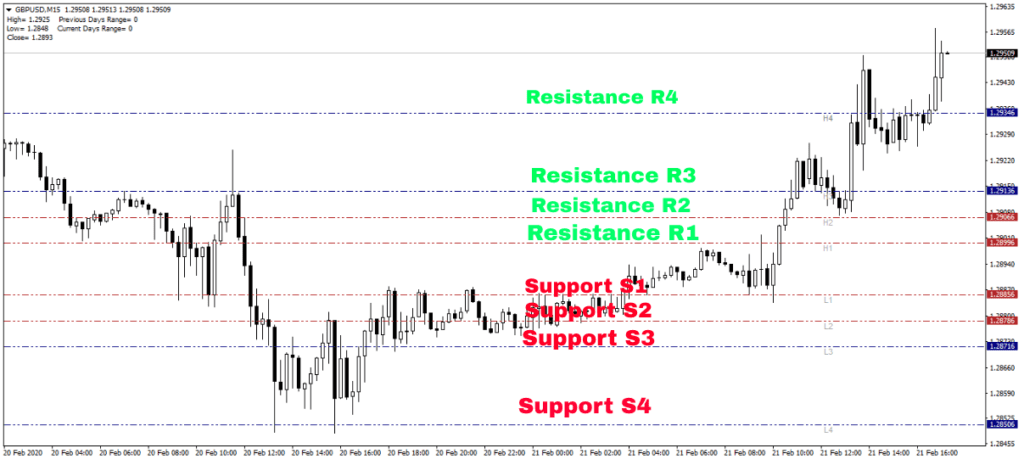
Camarilla pivots is an advanced S&R indicator that can help identify short-term and very short-term support and resistance levels. They reveal bullish and bearish price zones and indicate when a breakout may occur. This indicator works by calculating a centre price point and 4 support and resistance levels on each side of it. Here’s the calculation:
Pivot point (PP) = (High + Low + Closing) / 3
First support (S1) = Closing – [(High -Low) x 1.0833]
First resistance (R1) = Closing + [(High -Low x 1.0833]
Second support (S2) = Closing – [(High -Low) x 1.1666]
Second resistance (R2) = Closing + [(High -Low) x 1.1666]
Third support (S3) = Closing – [(High -Low) x 1.2500]
Third resistance (R3) = Closing + [(High -Low) x 1.2500]
Fourth support (S4) = Closing – [(High-Low) x 1.5000]
Fourth resistance (R4) = Closing + [(High -Low) x 1.5000]
Here’s a simple strategy with Camarilla pivot points:
Image: Camarilla Pivots
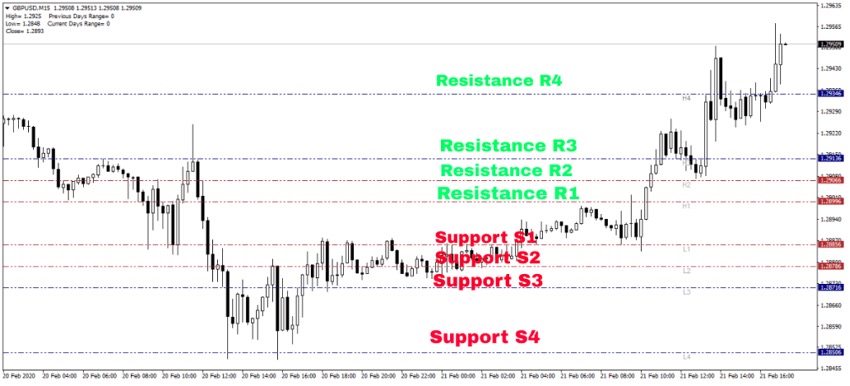
When the price is ranging, experienced traders:
- Buy near predetermined support levels
- Sell near predetermined resistance levels
When the market is ready for a breach of S&R, traders tend to:
- Buy during bullish reversals, when the price touches S3, with a stop loss below S4.
- Sell during a bearish reversal, when the price touches R3, with a stop loss above R4.
Trading with Support and Resistance
There are two popular techniques of trading in ranging markets:
Range Trading
Range trading involves a fast-paced trading plan to identify visible highs and lows within the range and take appropriate positions. For instance, identifying a visible high where prices may reverse (within the range) to open sell trades. Similarly, traders may look for a support level and take long positions when the price reaches near it, as an upward reversal may occur.
Trades must remember that S&R are more of zones, rather than price points. They identify optimal entry and exit points to minimise risk and maximise potential profit. This can be done by combining other indicators, such as RSI or ADX.
ADX, for instance, can confirm that the market is range-bound when it trends below 25. An oscillator, say RSI, can validate the S&R levels. It also shows overbought and oversold regions for traders to open short or long positions.
Breakout Trading
Price does not usually hold at any key level. It breaks out of the range and rallies upward or downward according to market forces. Breakouts are usually signalled by a price consolidation. When price breaches support, a downtrend typically sets in. This is the time to place sell orders. Conversely, a breach of resistance indicates the beginning of an uptrend, and traders open buy orders to take advantage of the potential rally.
Traders must remember that false signals may occur. Price may quickly spike and fall back within the range. So, traders must use more than one indicator to confirm a potential rally before taking positions. ROC and MACD are the most popular momentum indicators used to confirm a breakout. The underlying idea is that strong momentum will facilitate a range to sustain, and this is when traders take positions. In case of weak momentum, it may be better to wait and watch.
To Sum Up
- Support and resistance (S&R) levels serve as entry and exit points.
- Support is the price level at which the price of an asset tends to bounce back up.
- Resistance is a level from which prices tend to fall.
- S&R are first signs of a change in trend.
- There are 3 types of support and resistance levels – fixed, dynamic and semi-dynamic.
- The most popular indicators for identifying support and resistance levels are Fibonacci retracement and Camarilla pivots.
- The 2 popular techniques of trading in ranging markets are Range Trading and Breakout Trading.
- To avoid making a wrong decision based on false signals, it’s best to use more than one indicator to confirm a potential uptrend or downtrend.
Disclaimer:
All data, information and materials are published and provided “as is” solely for informational purposes only, and is not intended nor should be considered, in any way, as investment advice, recommendations, and/or suggestions for performing any actions with financial instruments. The information and opinions presented do not take into account any particular individual’s investment objectives, financial situation or needs, and hence does not constitute as an advice or a recommendation with respect to any investment product. All investors should seek advice from certified financial advisors based on their unique situation before making any investment decisions in accordance to their personal risk appetite. Blackwell Global endeavours to ensure that the information provided is complete and correct, but make no representation as to the actuality, accuracy or completeness of the information. Information, data and opinions may change without notice and Blackwell Global is not obliged to update on the changes. The opinions and views expressed are solely those of the authors and analysts and do not necessarily represent that of Blackwell Global or its management, shareholders, and affiliates. Any projections or views of the market provided may not prove to be accurate. Past performance is not necessarily an indicative of future performance. Blackwell Global assumes no liability for any loss arising directly or indirectly from use of or reliance on such information herein contained. Reproduction of this information, in whole or in part, is not permitted.


