

How to Use Renko Charts for Trading?
A Renko trading chart is similar to a candlestick chart, although it comprises “bricks” rather than candlesticks, to visually depict asset price moves. It can be more effective than candlestick charts because it filters out the “noise” of constant, small price moves to help you identify price trends and their momentum better. With this simplified view, the Renko technical analysis tool eliminates the time factor to help you recognise broader market patterns.
How to Use a Renko Chart?
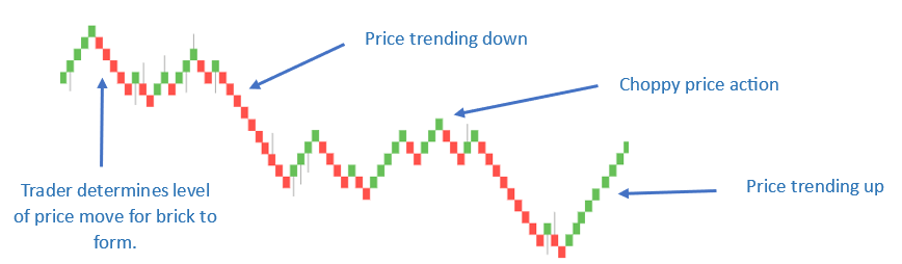
Renko trading charts are made up of red and green bricks. The bricks are usually at a 45-degree angle, up or down, to the previous one. Unlike candlesticks, no two bricks will appear at the same level as the previous one. The best part is that you can customise the brick size, which will determine when the next brick forms.
For example, let’s say you are trading the EUR/USD and decide that each brick will represent 10 pips of price movement. This means the price will need to move 10 pips above or below the previous price for a new brick to form. However, since bricks cannot form next to each other, the next brick will form only when the price moves 20 pips, up or down, from the previous closing price.
To use Renko charts effectively, you need to understand its basic principles.
- Each brick represents a predetermined price movement, known as the box size.
- When the price exceeds this box size, a new brick is added in the direction of the price trend.
- If the price movement is insufficient to form a new brick, no bricks are added, resulting in a cleaner price chart, devoid of minor fluctuations.
You can adjust the box size based on the price volatility of your chosen asset. A smaller box size captures smaller price movements, while a larger box size filters out minor moves to focus on significant price changes. You can also customise the brick type, such as using filled or hollow bricks, whichever you prefer.
Pros and Cons of Renko Charts
Every technical analysis tool and price chart comes with its own benefits and limitations, and Renko Charts are no different.
Pros
- Trend Clarity: Renko trading charts excel in capturing trends by filtering out noise, making it easier for traders to identify and follow the prevailing market sentiment.
- Simplicity: They offer a straightforward visual representation of price movements, allowing traders to focus on broader market conditions, without distractions.
- Reduced False Signals: Since bricks are plotted based on price moves, rather than time intervals, they tend to generate fewer false signals, helping traders identify entry and exit points more effectively.
Cons:
- Delayed Signals: Due to the nature of Renko charts, which require a minimum price move to form a new brick, signals may be delayed, as compared to traditional time-based charts.
- Limited Analysis of Historical Data: Recent price moves are prioritised, which could limit in-depth analysis of historical data, as compared to other methods of technical analysis.
- Box Size Selection: Choosing the best-suited box size can be challenging, especially for beginners, since you need to balance capturing price movements with filtering out noise. Experiment with different box sizes to discover the optimal setting for your trading strategy.
Renko Trading Strategies
Trend Following
One of the most common strategies to trade Renko charts involves trading in the direction of the prevailing price trend. Traders tend to make the trading decision to enter long positions when a series of bullish bricks form, signalling an upward trend, while short positions are taken when bearish bricks are formed.
Breakout Trading
Breakout traders can use Renko charts to identify key support and resistance levels. Breakouts above the resistance or below the support levels can signal potential trading opportunities. The idea here is to use the Renko chart to open positions early in a new trend while placing the stop-loss at the point of break out.
Range Trading
Since breakouts are easy to identify with Renko charts, this technical analysis tool is popular for range trading. A ranging market will move between the support and resistance levels, with the Renko bricks alternating within that price range for some time. Range traders buy when the price is near the support level and sell when the price closes in on the resistance level.
Points to Keep in Mind
Renko charts can be combined with other indicators, such as moving averages, oscillators and trendlines, to confirm trading signals. Here are some other factors to consider while using these trading charts.
Practice and Patience
As they say, “Practice makes perfect.” Use a demo account to familiarise yourself with Renko charts. Experiment with different box sizes and brick types to understand how they influence chart patterns and trading signals.
Risk Management
Experienced traders make proper risk management is an indispensable part of their trading strategies. So, don’t forget to set your stop-loss and take profit orders, while adhering to position-sizing principles, to protect your capital.
Adjusting to Market Conditions
Renko charts may perform differently under different market conditions. Adapt your trading strategy and trading decision accordingly to accommodate changing volatility and trends.
Continuous Learning
This is what separates great traders from the good ones. Attend seminars, read books, and engage with online communities to expand your knowledge and skills.
To Sum Up
- Renko charts are used to show price movements, eliminating the element of time and making trends easy to spot.
- Changing the brick size, based on asset volatility, can offer clearer signals.
- Renko charts also reduce false signals.
- However, signals might be delayed, historical analysis limited, and choosing the right brick size can be tricky for beginners.
- Trading strategies using these charts include trend following, trading breakouts, and range trading.
- Practice, risk management, understanding changing market conditions and continuous learning are crucial for mastering Renko charts.
Disclaimer
All data, information, and materials are published and provided “as is’ ‘ solely for informational purposes only and are not intended nor should be considered, in any way, as investment advice, recommendations, and/or suggestions for performing any actions with financial instruments. The information and opinions presented do not take into account any particular individual’s investment objectives, financial situation, or needs, and hence do not constitute advice or a recommendation concerning any investment product. All investors should seek advice from certified financial advisors based on their unique situation before making any investment decisions by their personal risk appetite. Blackwell Global endeavours to ensure that the information provided is complete and correct, but makes no representation as to the actuality, accuracy, or completeness of the information. Information, data, and opinions may change without notice and Blackwell Global is not obliged to update on the changes. The opinions and views expressed are solely those of the authors and analysts and do not necessarily represent those of Blackwell Global or its management, shareholders, and affiliates. Any projections or views of the market provided may not prove to be accurate. Past performance is not necessarily indicative of future performance. Blackwell Global assumes no liability for any loss arising directly or indirectly from the use of or reliance on such information herein contained. Reproduction of this information, in whole or in part, is not permitted.


