

Hammer / Hanging Man MT4 Indicator
Candlestick based pattern that identifies important reversal levels. A hanging man is a type of bearish reversal pattern, made up of just one candle, found in an uptrend of price charts of financial assets. It has a long lower wick and a short body at the top of the candlestick with little or no upper wick. In order for a candle to be a valid hanging man most traders say the lower wick must be two times greater than the size of the body portion of the candle, and the body of the candle must be at the upper end of the trading range.
A hammer is a type of bullish reversal candlestick pattern, made up of just one candle, found in price charts of financial assets. The candle looks like a hammer, as it has a long lower wick and a short body at the top of the candlestick with little or no upper wick. In order for a candle to be a valid hammer most traders say the lower wick must be two times greater than the size of the body portion of the candle, and the body of the candle must be at the upper end of the trading range.
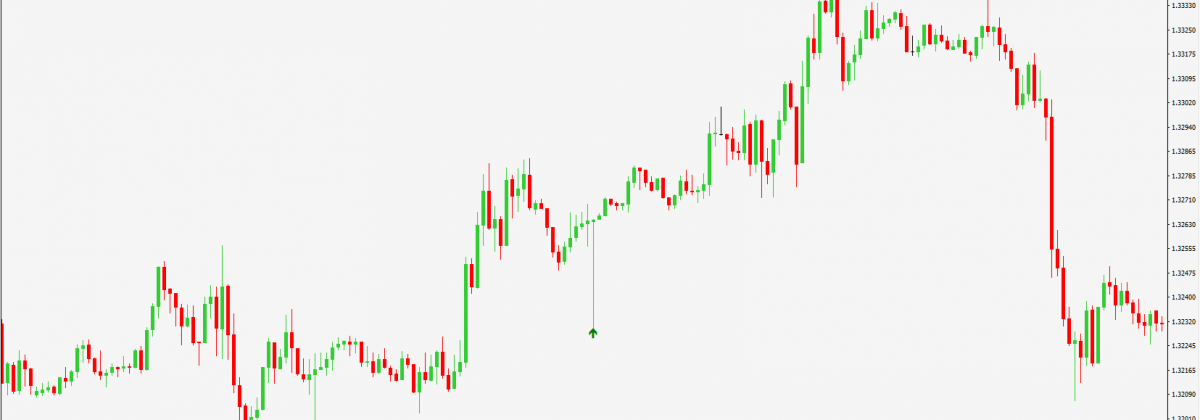
When you see the hammer form in a downtrend this is a sign of a potential reversal in the market as the long lower wick represents a period of trading where the sellers were initially in control but the buyers were able to reverse that control and drive prices back up to close near the high for the day, thus the short body at the top of the candle.
After seeing this chart pattern form in the market most traders will wait for the next period to open higher than the close of the previous period to confirm that the buyers are actually in control.
Two additional things that traders will look for to place more significance on the pattern are a long lower wick and an increase in volume for the time period that formed the hammer.