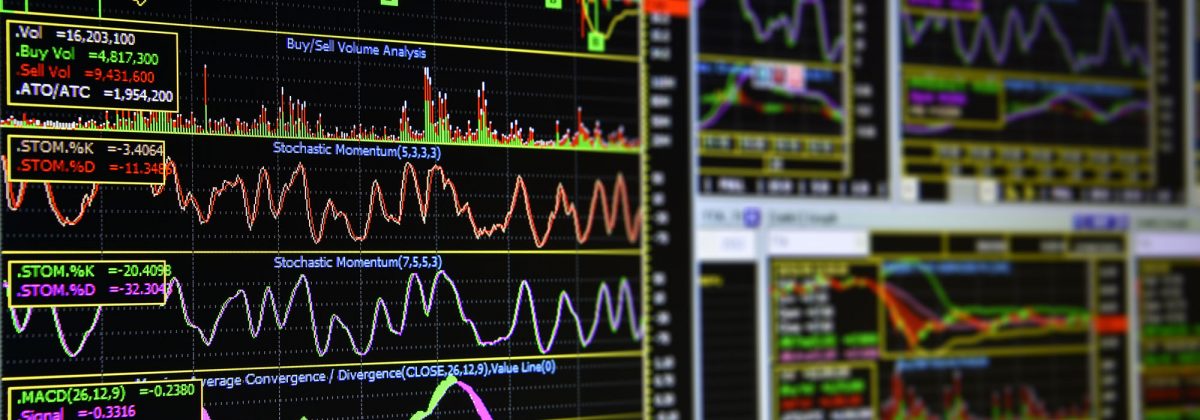
Best MT4 Indicators for Intraday Trading

As an intraday trader, you need to move quickly to make the most of small price movements. This means that you can’t waste time on too many indicators. Spending too much time on multiple tools may lead to missed opportunities. What is more efficient is to focus on a couple of indicators that work effectively to identify trading opportunities, while minimising risk. This is one case where less is more, but you need to choose carefully.
And, to be able to make an informed choice, you first need to know which indicators work the best for intraday timeframes.
Relative Strength Index (RSI)
This indicator works on the principle of “buy low and sell high.” RSI is highly useful in indicating when an asset is oversold or overbought and when it may face a reversal. You can set the RSI according to different timeframes, while the values can range from 0 to 100. Here, 100 indicates overbought and zero indicates oversold. The values that lie in between show the expected trend of prices in the market.
For example, if the value of the Relative Strength Index reaches 70, the price is expected to fall and selling would be a suitable option. If the value reaches 30, it will most likely increase and buying is indicated at this point.
However, given that all assets or even currency pairs do not follow the same pattern, it is a good idea to first analyse past RSI values, along with market volatility before making a decision.
Moving Average Convergence Divergence
Also known as MACD, this indicator works on the basis of divergence and convergence of two moving average values. It provides information about the direction and duration of a trend, as well as the momentum.
The MACD value is the difference between the 26-day exponential moving average (EMA) and the 12-day EMA. This difference in value is used for drawing the MACD line. The area covered by the MACD spread in the positive section of the chart shows an upward trend. On the other hand, if the MACD spread covers an area on the negative side, it shows a downward trend.
Apart from this, a signal line is also drawn with the help of the 9-day EMA. If the MACD line goes above the signal line, it usually indicates buying. If it stays below the signal line, a sell signal is generated.
Bollinger Bands@
Bollinger Bands were developed by an American author named John Bollinger. These indicators hold a greater advantage over the simple moving average (SMA) indicators. Bollinger Bands form a zone around the price movements of a commodity or asset. These zones are created on the basis of a moving average and a number of standard deviations. Through the help of this indicator, you can predict the direction of trend movements, identify reversals and gauge the volatility. All these things are crucial for making informed trading decisions.
Constituents of Bollinger Bands
These bands comprise three main lines, the lower, the middle and the upper lines. The middle line represents a moving average of the prices and the parameters for this moving average are chosen by the trader. The lower and the upper bands are placed on either side of this middle line and the distance between them is calculated through standard deviation. You can choose the number of standard deviations that you want the indicator to consist of. Most people make use of two standard deviations.
An asset that is trading below the lower line can experience an increase in its future price. So, buying is indicated. Conversely, if the price has risen above the upper line, it is considered a sell signal.
Momentum Oscillators
Asset prices can rise and fall really quickly. Along with this, there are also short periods that are not related to a bearish or bullish market sentiment. So, it is highly possible that you may unknowingly ignore such rapid developments. This is where indicators like momentum oscillators prove to be useful in intraday trading.
The oscillator values range from zero to 100 and these indicate changes in market trends. There are different types of momentum oscillators used in intraday trading.
On Balance Volume
Commonly known as OBV, this is a type of momentum indicator that predicts changes in prices on the basis of volume flow. To calculate the selling and buying pressure, it subtracts the sum of the volumes on down days from the sum of the volumes on up days.
There are three rules regarding the calculation of the current OBV:
- If a particular closing price is higher than the previous closing price, the current OBV becomes the sum of the current volume and previous OBV.
- If the closing price is lower than the previous closing price, the current OBV is the difference between the sum of current volume and previous OBV.
- If the closing price is the same as that of the previous closing price, the previous OBV becomes the current OBV.
Stochastic Oscillators
This is considered as the most efficient momentum oscillator because rather than considering the prices or volume, it takes into account the momentum. So, it provides a better indication of trends during trading, since momentum changes its direction faster than price does.
All these indicators can prove to be helpful in intraday trading but be very careful while using them. Sometimes, trends can move in a direction that is quite different from what is suggested by the indicator. So, a thorough technical analysis, coupled with insights from other indicators, is needed to make an informed decision.
While each indicator has its pros and cons, it is best to try them all on a demo account and gain familiarity before choosing one to use under live market conditions.
Reference Links
- https://www.adigitalblogger.com/intraday-trading/best-intraday-trading-indicators/
- https://www.niftytradingacademy.net/intraday-trading/intraday-trading-indicators
- https://www.tradeciety.com/tips-how-to-use-the-macd/
- https://www.thebalance.com/day-trading-with-bollinger-bands-1031210
- https://in.tradingview.com/ideas/momentumoscillator/


