

Learn to Trade with the Heikin-Ashi Indicator
Heikin-Ashi or Heiken-Ashi means ‘average pace’ in Japanese. So, from its name, you already know that the indicator uses average price data to plot candlesticks and visualize market movements to help make informed trading decisions. The technique was developed by the creator of candlestick charts himself – Munehisa Homma. At first glance, this indicator may look complicated, but it’s not difficult to use even for novice traders. Here’s a look at the indicator and some trading strategies to make the most of it.
Plotting HA Candles
Heikin-Ashis are considered better candlesticks than the ones traders typically use. This is because they incorporate the average from previous and current prices, eliminating the noise.
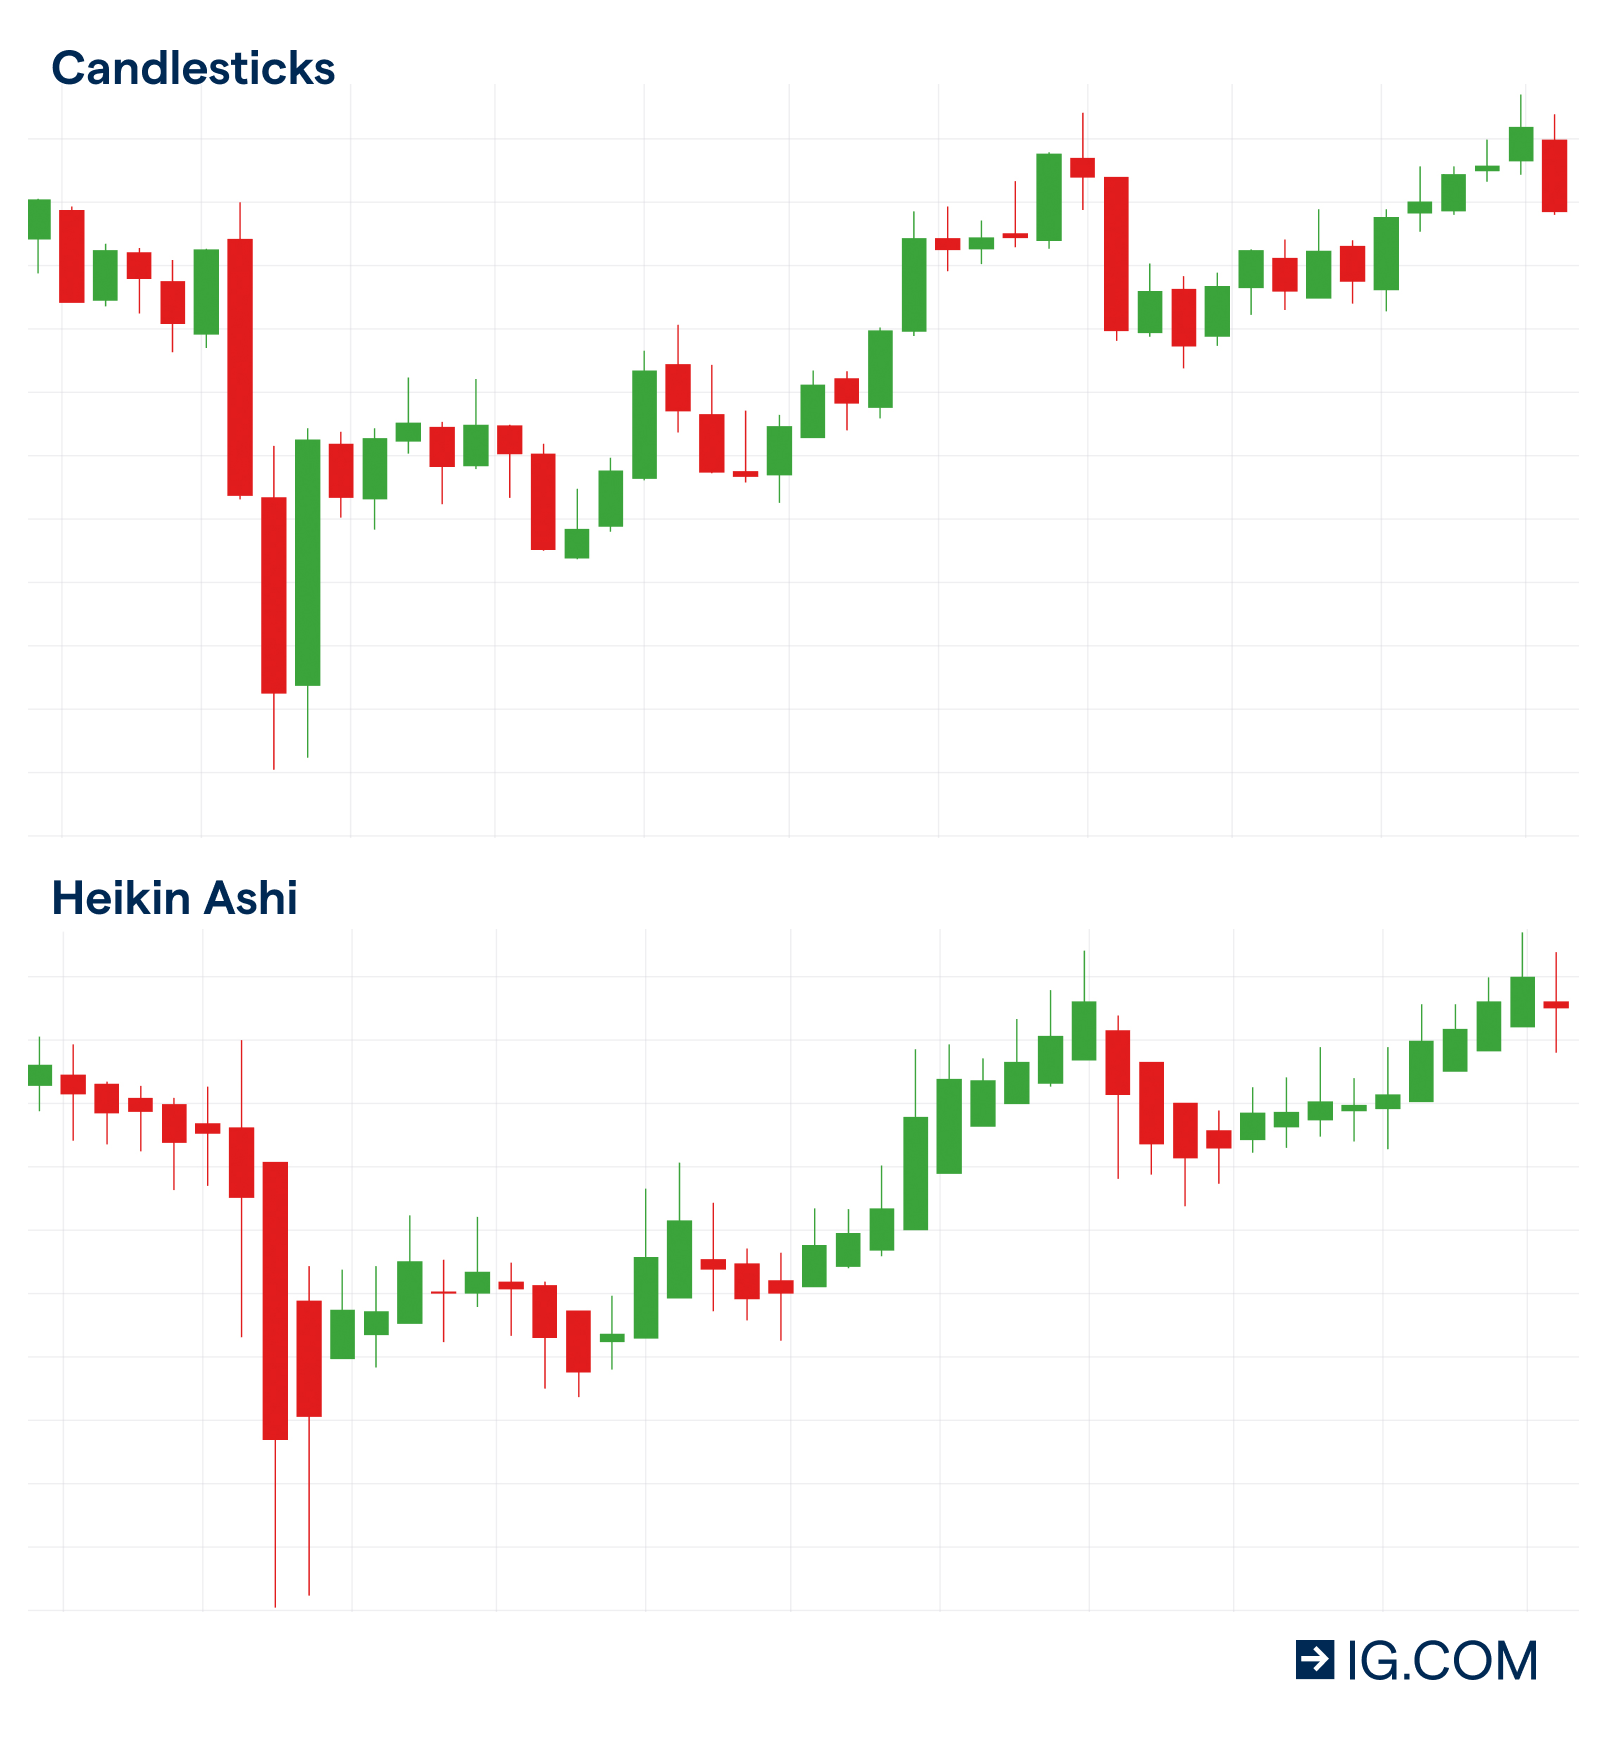
Image: Traditional vs Heikin-Ashi Charts
The formulae to plot HA-candles are:
HA Open = (HA Open−1_ + HA Close−1_)/2
HA Close = (Open0 + High0_ + Low0 _+ Close0__)/4
HA High = Max (High0_, HA Open0_, HA Close0_)
HA Low = Min (Low0_, HA Open0_, HA Close0_)
The 0 suffix shows that these are values from the current period, while the −1_ indicates that these values are from the prior period.
Types of Heikin-Ashi Candles
There are 3 main types of candles:
- Bullish – Long green bodies with significant upper wick and no lower wick
- Bearish – Long red bodies with significant lower wick and no upper wick
- Reversal – These look like Doji candlesticks (small bodies and very long wicks that are at least twice the height of the body)
Pros and Cons of Using the Heikin-Ashi Indicator
Due to its unique nature, the HA indicator has many advantages that drive traders to incorporate it in their trading strategies:
- HA charts are most useful when the market is relatively quiet. These charts help you make better trading choices.
- The visual representation and resemblance to candlestick charts simplify the interpretation of the signals.
- HA candles enhance signals and often show signals when trading opportunities cannot be discovered with standard candlestick charts.
- HA charts highlight long-term trends by removing short-term volatility. This reduces false signals and minimises retracements.
A few disadvantages of HA-Charts are:
- Since it uses the current price in the calculation of averages, HA is considered a lagging indicator and is most useful during trending markets. This also makes them unsuitable for high-frequency trading, although they are apt for intra-day trading strategies.
- Using HAs does have a learning curve.
Interpreting Heiken-Ashi Candles
Heiken-Ashi candles can be used for a variety of assets, including forex, stocks and commodities. All you need to do is to set up a timeframe and apply the indicator on your chosen instrument.
- Long green candles with no lower shadow or long red candles with no upper shadow indicate trend continuation. They indicate that the current trend has strength and momentum, and the direction of the trend is sustained.
- Candles reducing in size with lengthening wicks indicate a pause in the current trend or an upcoming reversal. Experienced traders use market analysis, other indicators, and sentiment analysis to speculate which one it is.
- When candles start resembling a Doji, a reversal is the most likely outcome. On reversal, the candle changes colour. However, during reversal testing or bounce-back, increased volatility may cause candles to change colour repeatedly while the market remains indecisive.
Trading with Heiken-Ashi
The most common use of the HA is to give you the confidence of holding your positions for longer. Here are a few trading strategies using HA charts:
Ride a Trend
Rising, long-bodied green candlesticks with no lower wick and a long upper wick signal a strengthening uptrend. You may open long positions or hold the positions you’ve already bought to maximise gains.
Falling, long-bodies red candlesticks with no upper and a long lower shadow indicate that the market is dominated by bears and the downtrend could continue for a while. You may consider holding onto your short positions to optimise gains from the bear trend.
Plan Your Exits
In an uptrend, when lower wicks start to appear, it is considered a signal of weakening bullish sentiment, which indicates that a reversal may be due. You may confirm the signal with other indicators and then plan their exits from long positions.
Similarly, the appearance of upper shadows and diminishing size of red candles indicate that bears are losing their grip on the market. If you have short positions, this may be a good time to exit them. If you’ve been on the sidelines to buy, you can use this opportunity to do so. In both cases, confirming the reversal with other indicators helps you make better decisions.
Trade Reversals
For trading reversals with HA, it is recommended to rely on broader signals, such as head and shoulders, triple tops or triple bottoms. This is because these occur when the reversal is sustained and apparent on the HA chart. In this case, trading decisions are made in the same manner as trading with normal candlesticks.
| Heikin-Ashi Signals | ||
| Trend Behaviour | Uptrend | Downtrend |
| Normal | Rising green bodies | Falling red bodies |
| Strengthening | Rising, longer greens with no lower shadow | Falling, longer reds with no upper shadow |
| Weakening | Emergence of lower shadows and a reduction in size of candles | Emergence of upper shadows and a reduction in size of candles |
| Consolidation | Smaller bodies with growing upper and lower shadows | Smaller bodies with growing upper and lower shadows |
| Reversal | Tiny body with very long upper and lower shadows | Tiny body with very long upper and lower shadows |
Indicators to Combine With HA
Since HA shows the directional trend combining it with momentum indicators helps identify the strength of bears or bulls in the market. Knowing that the minor fluctuations causing noise have been eliminated, makes the discovered opportunities more reliable. The most commonly used indicators with HA charts are:
- Moving Averages
- Relative Strength Index
- Average Directional Index
Heiken-Ashi and Moving Averages Trading Strategy
Green HA candles show buying pressure, while red ones show selling pressure. Combining it with moving averages helps identify the dominant trend direction. Here is a popular strategy to combine the two:
Add the 50-day and 12-day simple moving average (SMA) to the HA chart.
- If the candles turn green from red, an uptrend is indicated. Buy when HA is clearly above the 50-day SMA line and the SMA is angled upward. HA must also be above the 12-day line.
- Exit when HA candles change colour again, i.e. goes from green to red.
- HA approaching closer to the 12-day SMA without changing colour indicates a loss of momentum, and traders consider it as an exit signal.
- Short or sell when HA turns red and the 50-day SMA is sloped downwards. HA should be below both 50- and 12-day SMAs with separation.
- Exit short trades when HA changes colour or approaches the 12-day SMA curve.
To Sum Up
- Heikin-Ashi is a visual technique that eliminates noise from the price chart, to elucidate trends and consolidations.
- HA-candlesticks help you decide whether to hold open positions and when to exit during an ongoing trend.
- The HA indicator is often used with the MA, RSA, and ADX indicators to strengthen the trading system with momentum indicators.
Disclaimer:
All data, information and materials are published and provided “as is” solely for informational purposes only, and is not intended nor should be considered, in any way, as investment advice, recommendations, and/or suggestions for performing any actions with financial instruments. The information and opinions presented do not take into account any particular individual’s investment objectives, financial situation or needs, and hence does not constitute as an advice or a recommendation with respect to any investment product. All investors should seek advice from certified financial advisors based on their unique situation before making any investment decisions in accordance to their personal risk appetite. Blackwell Global endeavours to ensure that the information provided is complete and correct, but make no representation as to the actuality, accuracy or completeness of the information. Information, data and opinions may change without notice and Blackwell Global is not obliged to update on the changes. The opinions and views expressed are solely those of the authors and analysts and do not necessarily represent that of Blackwell Global or its management, shareholders, and affiliates. Any projections or views of the market provided may not prove to be accurate. Past performance is not necessarily an indicative of future performance. Blackwell Global assumes no liability for any loss arising directly or indirectly from use of or reliance on such information herein contained. Reproduction of this information, in whole or in part, is not permitted.

