MT4 Tutorial: Learn How to Get Started and Customise Charts

MetaTrader is by far the most popular trading platform around the world. Its simple design, intuitive interface, and easy navigation make MT4 the preferred platform among beginners and seasoned traders alike. This all-in-one platform gives you tools for trading forex, indices, and commodities. The ability to drag and drop inbuilt indicators onto the trading chart makes technical analysis accessible and trading highly efficient. Here’s a step-by-step MT4 training guide that makes it even easier for you to get started.
MT4 Tutorial: How to Download MT4?
Here are the steps to download MT4 on your computer or phone.
Step 1: Register for a trading account with us. This could be a demo account or live account.
Step 2: You can download MT4 for free. To download MT4 on your PC, click here. If you wish to use your smartphone for trading, click here if you have an Android phone. If yours is an iPhone, click here.
Step 3: Run the downloaded file. For Mac, you will need to install PlayOnMac to run the file.
Step 4: Our user-friendly install wizard will take you through the MT4 set-up process.
Step 5: Login to MT4 with your registered email address or phone number.
MT4 Tutorial: Understanding the MT4 Screen
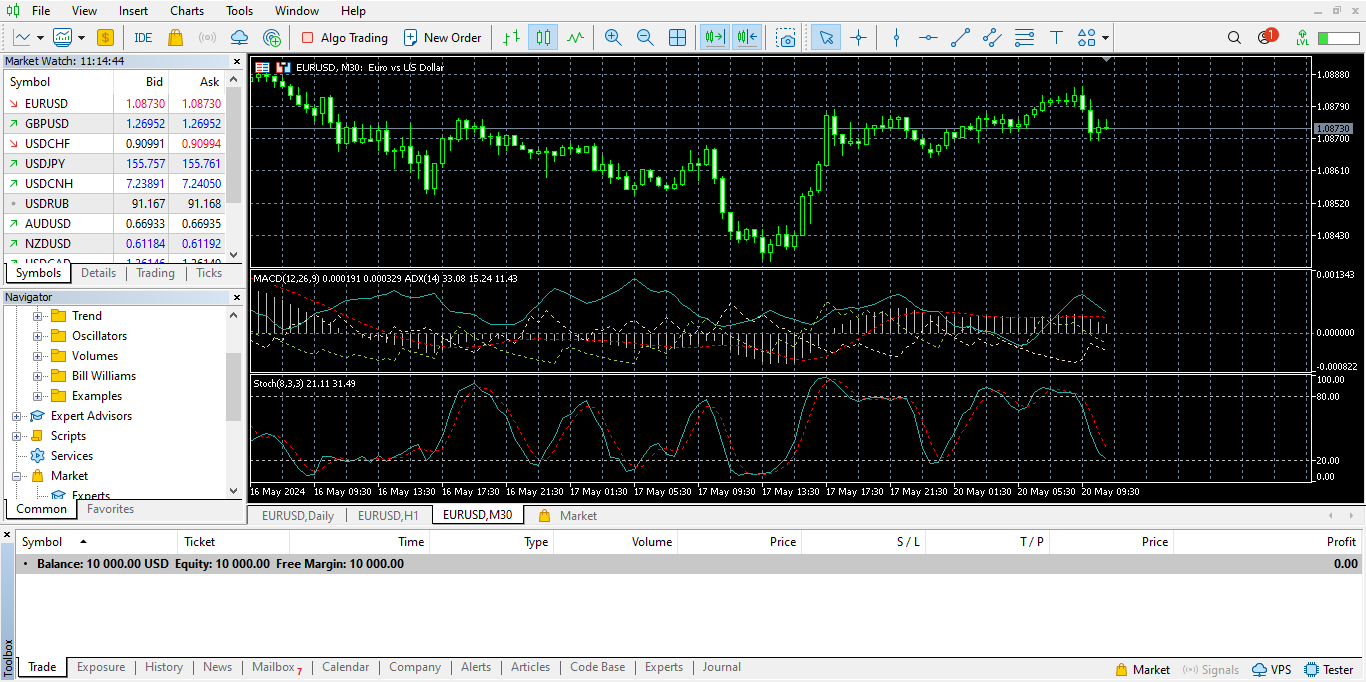
The main screen of your MT4 trading platform has 4 main sections:
- Market Watch
- Navigator
- Chart Area
- Terminal
- Market Watch
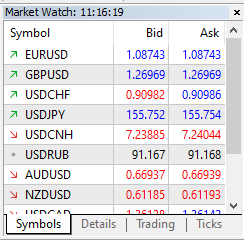
This appears on the left of your Chart Area and displays all the instruments that can be traded, like forex pairs, indices, precious metals, and commodities. It also mentions the and ask prices of each.
Simply drag and drop the chosen instrument into the Chart Area to view its chart. Right click on the instrument to access options like New Order (to open a trade) and Specifications (to know details like spread and contract size).
- Navigator
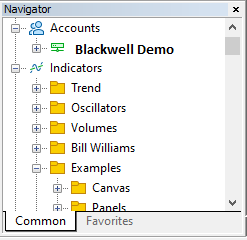
This appears just below Market Watch and allows you to log into any of your trading accounts. Use your demo account to test trading strategies before opening positions in the live market.
The Indicators folder has several free indicators for technical analysis that you can simply drag and drop on the chart. Screen down to access a host of features, including Expert Advisors and VPN.
- Chart Area
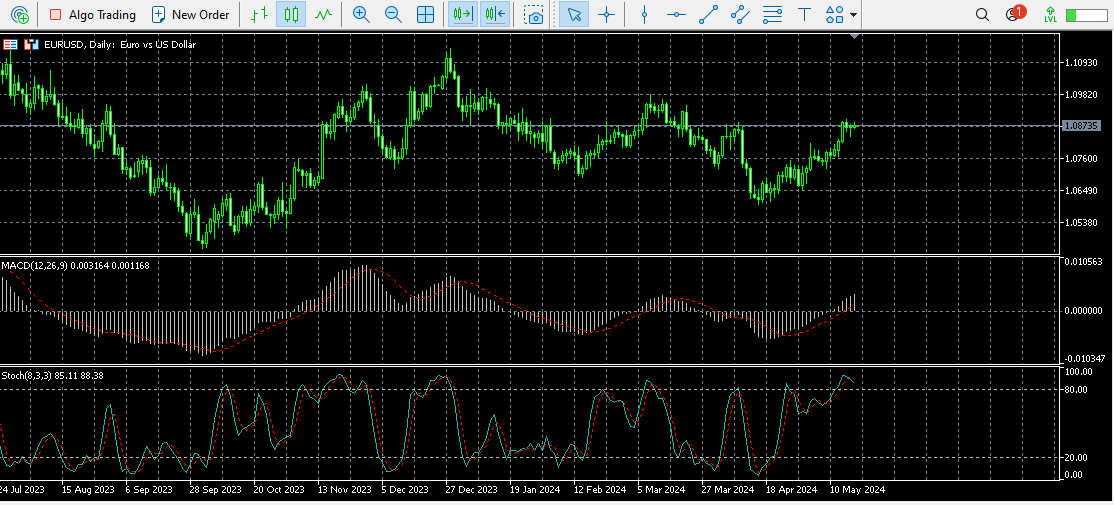
This shows the chart (price movements) of the chosen instrument. From the top navigation, you can open a new order, choose the chart type (bar, candlestick, or line chart), magnify, or view up to 4 charts on this screen.
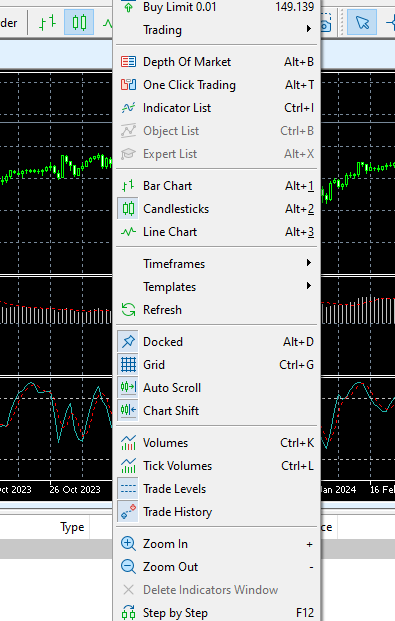
The chart is where all the action of trading takes place. Right clicking on the chart will open several options, including Depth of Market (shows the number of open buy and sell orders at various prices), One Click Trading (opens the bid and ask panel), and Timeframes (from 1 minute to 1 month).
- Terminal
This gives you quick access to different features that you can access by switching between the tabs at the bottom. Some of the important tabs are:
- Trade: Displays your open positions and pending orders.
- History: Shows all your executed trades. It also shows your deposits, profit and loss, and withdrawals.
- News: Find all important and relevant news headlines.
- Calendar: Lists all upcoming economic data releases.
- Alerts: Use this to set up notifications for when an asset has reached a specific price or a certain parameter in an indicator has been met.
- Experts: Has all information about Expert Advisors (EAs) in your account.
- Journal: This displays information about your account, like login times, opened and closed positions, etc.
How to Customize Charts on MT4
This section of the MT4 tutorial gives a step-by-step training guide on how to customise charts.
Step 1: Right click on the chart you wish to customise.
Step 2: From the list of options that open, select click on Properties.
Step 3: On the popup that opens, the Colors tab allows you to choose your preferred colors for various elements of the chart, like background, foreground, grid, bull candle, bear candle and stop loss levels.
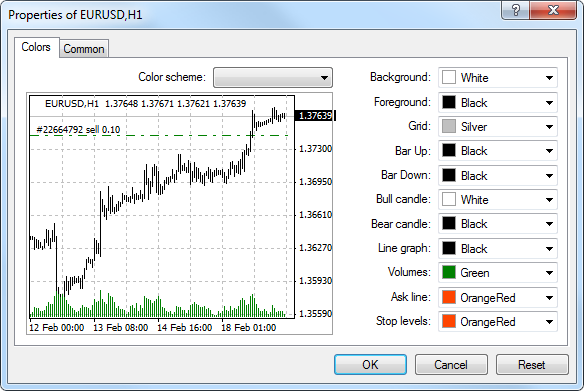
Step 4: Click on the Common tab to customise various features of the chart.
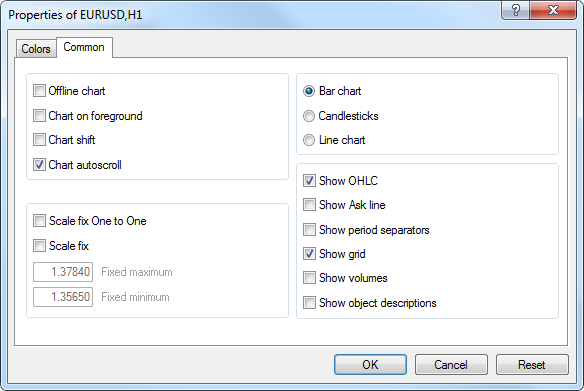
This tab has some interesting options:
- Offline chart: Freezes the chart (stops receiving new price data).
- Chart on foreground: Places the chart in the foreground of all analytical objects.
- Chart shift: This option shifts the chart to the shift mark (a triangle that appears on top of the chart window and can be moved within the window size).
- Chart autoscroll: This is selected by default and allows the chart to scroll automatically to the left as the market moves and forms new bars or candlesticks on the right.
- Choose the type of chart from the Bar chart, candlesticks, and line chart options.
- Show OHLC: Selecting this creates an additional data line at the top left of the chart window, showing the Open, High, Low and Close (OHLC) prices.
- Show Ask line: This shows the Ask price of the latest quote.
- Show period separators: Selecting this creates additional vertical lines corresponding with a larger timeframe (period). For instance, in charts with timeframes of minutes and hours, an additional vertical line of the weekly period is shown.
- Show grid: Shows gridlines on the chart.
- Show volumes: Shows the volume chart just below the chart of the instrument.
- Show object descriptions: Shows object descriptions directly on the chart.
How to Open a Trade on MetaTrader
Once you have selected your preferred instrument from the Market Watch window, you can simply click on New Order in the top navigation. A popup will appear.
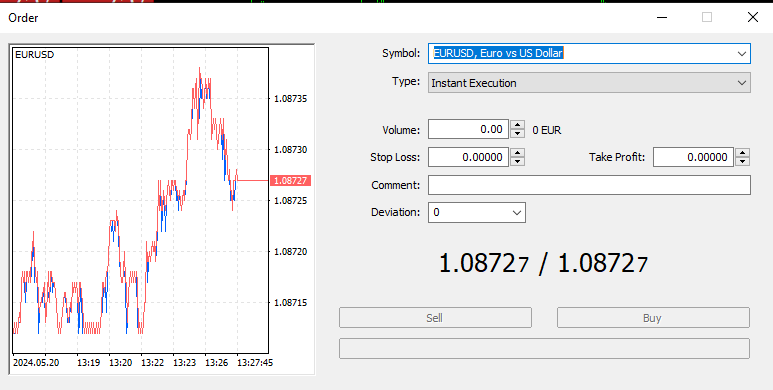
Here you can choose between Instant Execution and Pending Order.
Instant Execution: Select the volume, stop loss, take profit, and your acceptable deviation. Then click on Buy or Sell.
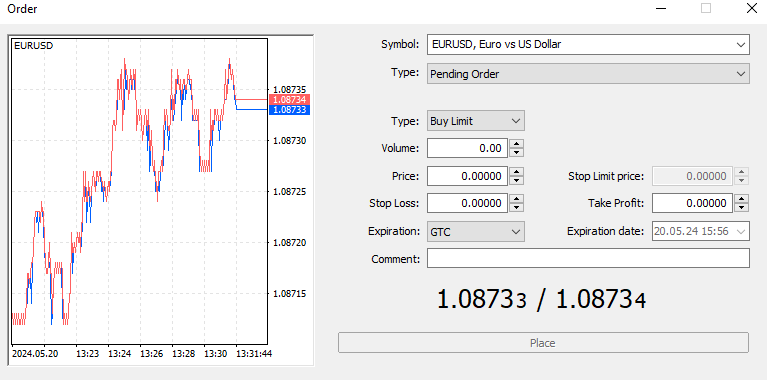
Pending Order: Select the order limit, volume, stop loss, take profit, and expiration date. Then click on Buy or Sell.
MetaTrader is very user-friendly, although the sheer number of features and options makes it a little confusing for first time traders. The good news is that you can check out all the trading tools on the demo account for free. This helps you become familiar with the trading platform before entering live trading.
Disclaimer
All data, information, and materials are published and provided “as i” solely for informational purposes only and are not intended nor should be considered, in any way, as investment advice, recommendations, and/or suggestions for performing any actions with financial instruments. The information and opinions presented do not take into account any particular individual’s investment objectives, financial situation, or needs, and hence do not constitute advice or a recommendation concerning any investment product. All investors should seek advice from certified financial advisors based on their unique situation before making any investment decisions by their personal risk appetite. Blackwell Global endeavours to ensure that the information provided is complete and correct, but makes no representation as to the actuality, accuracy, or completeness of the information. Information, data, and opinions may change without notice and Blackwell Global is not obliged to update on the changes. The opinions and views expressed are solely those of the authors and analysts and do not necessarily represent those of Blackwell Global or its management, shareholders, and affiliates. Any projections or views of the market provided may not prove to be accurate. Past performance is not necessarily indicative of future performance. Blackwell Global assumes no liability for any loss arising directly or indirectly from the use of or reliance on such information herein contained. Reproduction of this information, in whole or in part, is not permitted.


