

Popular Cryptocurrency Trading Strategies

Like trading forex, precious metals and stocks, cryptocurrency trading requires careful market analysis and access to resources that can help you enhance your trading skills. Digital currencies can be traded via cryptocurrency exchanges or trading platforms that offer CFD trading in cryptos. Both types of trading are popular, although beginners tend to favour CFDs. But we’ll come to that later.
After opening an account with a broker offering crypto trading, finalise an efficient trading strategy that aids in informed decision-making, preventing you from being impulsive or led by emotions. Let’s look at some of the popular trading strategies used for cryptocurrencies.
Trading Strategies for Cryptos
Cryptocurrencies differ from fiat currencies, whose values are controlled by central banks. Digital currencies derive their value from several factors, including their demand and rareness. This makes them highly volatile in nature and they often move contrary to traditional asset classes.
Traders use fundamental and technical analyses to take advantage of the volatility in crypto prices. This requires good research and education on using specific indicators and trading tools to manage the risks involved in crypto trading.
Some popular crypto trading styles are:
- Range Trading: This calls for identifying the pattern and range in which a cryptocurrency is trading. Range trading involves identifying overbought and oversold zones by using indicators like the stochastic oscillator and the relative strength index (RSI).
- Scalping: This strategy involves entering and exiting multiple trades throughout the day to make the most of even the smallest price changes. The aim is to make a profit by adding up small gains across several trades in a single day.
- Swing Trading: This trading style aims to capitalise on short-to-medium-term price movements. However, this style requires good research, technical and fundamental analysis, and market timing.
Whether you choose range trading, swing trading or scalping, you will need technical indicators to analyse market trends.
Strategies Based on Technical Indicators
Moving Average Crossovers
As the name suggests, this strategy uses moving averages to identify the current trend’s direction and support and resistance levels. The crossover strategy calls for looking for a change in the trend by checking whether the price of the asset crosses above or below a moving average trend line, and then deciding whether to go long or short.
Another way is to use two moving averages, one short-term (e.g 50 day) and another long-term (200 day), to check whether it is a divergence crossover or a convergence crossover.
When the shorter moving average crosses over the longer one, it is a convergence or gold cross and indicates that the trend is shifting up and a long position could be warranted.
Similarly, when the shorter moving average trend line crosses below the longer moving average, it is a divergence or death cross, indicating that the trend is likely to move downwards, and a short position could be opened.
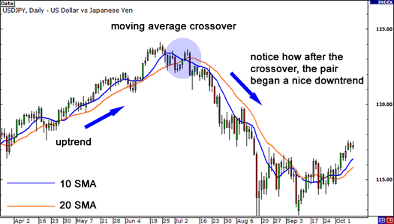
Image Source: https://www.babypips.com/learn/forex/moving-average-crossover-trading
Stochastic Oscillator
A highly popular crypto trading strategy is to use the stochastic oscillator to identify the best time to enter and exit a trade. The indicator, with a value range of 0 to 100, helps identify overbought and oversold market conditions for your chosen crypto. A reading above 80 indicates that the crypto is overbought and a reading below 20 is indicative of it being oversold.
Ichimoku Cloud
This strategy involves using the Ichimoku Cloud candlestick pattern to identify potential trend reversals, support and resistance levels and market momentum. This indicator consists of five candlesticks, of which the first two, The Tenkan-Sen and Kijun Sen, are used to identify potential trend reversals. The middle two candles, the Senkou Span A and Senkou Span B, are used to identify potential support and resistance levels. And the last one, the Chikou Span, is used to confirm the strength of the trend. The parameters of this tool can be customised according to your trading style and preference.
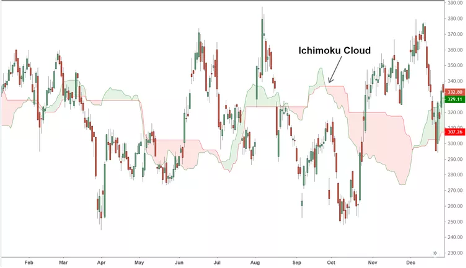
Image Source: https://www.investopedia.com/terms/i/ichimoku-cloud.asp
Relative Strength Index
The RSI is used to measure the short-term momentum of the market. It measures the pace and direction of recent price moves, thereby helping to identify the crypto’s trading strength. Some things to know about this indicator are:
- An RSI below 30 is considered to signal an oversold market while an RSI above 70 is considered overbought. Some traders also use 20 and 70 as the two levels. The choice of RSI levels can be based on whether it is a bull or bear market.
- A cryptocurrency is considered oversold when it sees persistent selling pressure and the RSI indicates that it is set to rally upwards. Similarly, it is considered overbought when it has been heavily bought but the RSI shows that it is due for downward correction.
- RSI can buy or sell a crypto CFD, trade between short-term price rises and declines, swing trading, or identify support and resistance levels.
Apart from using these technical tools, you can also check out event-driven trading, where traders enter positions based on the positive or negative news expected about a specific cryptocurrency. Regardless of the strategy you choose, it is essential to do your homework to make informed decisions.
Trading Crypto CFDs
Trading cryptos can happen directly by buying and selling the digital asset on a crypto exchange. This requires the trader to create an account and open a digital wallet to store the crypto tokens. This form of trading also requires traders to fund the full value of the positions taken.
An attractive alternative for traders who do not wish to take possession of the cryptocurrency and the hassle of ensuring safe storage is to trade leveraged derivatives. Contracts for Difference or CFDs allows traders to speculate on price movements without having to own the underlying asset. With the availability of leverage, you need only fund a fraction of the cost of opening a position. Plus, you get to trade both rising and falling prices.
To Sum Up
- Cryptos can be traded directly through the exchanges or via brokers that offer CFD trading.
- Cryptos tend to be highly volatile, which makes careful fundamental and technical analysis invaluable.
- Popular crypto trading styles include range trading, scalping, swing trading and news-based trading.
- These trading styles require a well-defined trading strategy that makes use of technical indicators like Moving Average Crossovers, Stochastic Oscillator, RSI and Ichimoku Cloud.
- These technical indicators help traders identify trend direction, momentum, support/resistance levels and more.
- CFD trading allows traders to make the most of both rising and falling crypto prices without needing to own the underlying alt coin.
Disclaimer:
All data, information, and materials are published and provided “as is” solely for informational purposes only and are not intended nor should be considered, in any way, as investment advice, recommendations, and/or suggestions for performing any actions with financial instruments. The information and opinions presented do not take into account any particular individual’s investment objectives, financial situation, or needs, and hence do not constitute as advice or a recommendation with respect to any investment product. All investors should seek advice from certified financial advisors based on their unique situation before making any investment decisions in accordance to their personal risk appetite. Blackwell Global endeavours to ensure that the information provided is complete and correct but make no representation as to the actuality, accuracy or completeness of the information. Information, data, and opinions may change without notice and Blackwell Global is not obliged to update on the changes. The opinions and views expressed are solely those of the authors and analysts and do not necessarily represent that of Blackwell Global or its management, shareholders, and affiliates. Any projections or views of the market provided may not prove to be accurate. Past performance is not necessarily an indicative of future performance. Blackwell Global assumes no liability for any loss arising directly or indirectly from use of or reliance on such information herein contained. Reproduction of this information, in whole or in part, is not permitted.


