

Simple Breakout Indicator Tips
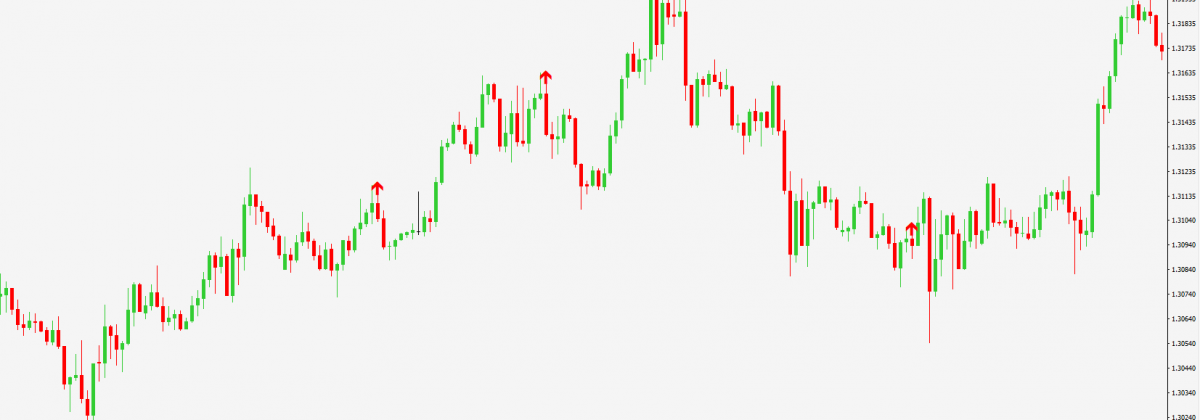
Relax and put down the pimple cream! Day breakouts don’t refer to acne attacks that take place during the day. In fact, it is a term used in forex trading, where there is a rise in price after it breaks above a certain resistance level. It can also take place when specific levels, such as pivot points, support and resistance levels or Fibonacci levels, are breached.
Breakout trading in forex is highly popular because it provides risk-reward ratios. Who would have thought a term you dreaded as a teenager would come to your rescue when you started day trading? Let’s find out more.
So, what is a Breakout?
Some might wonder what we mean when we say breakouts clear certain crucial levels on a chart. These levels are mostly psychological and are an indication of how day traders feel about certain price levels. The good thing about breakout day trading is that it can transform ordinary traders into extraordinary ones. The bad thing – many lose money day trading them too quickly, since prices sometimes revert to their initial mark. The solution, then, is to not trade until you’re sure the tide has turned your way. There are a number of indicators that can help you identify a genuine breakout from a ‘fake’ one.
Indicators to Use for Successful Breakout Trading
For trading breakouts successfully, the market condition should either be up trending, or range-bound, with the price action close to the upper end of that range. Indicators and strategies help you confirm a breakout, or predict its strength. Let’s take a look at them.
- Moving Average Convergence/Divergence or MACD: The MACD indicator is a common indicator that forex traders use, and there’s a good reason why. The indicator is very dependable, yet simple, and can be analyzed using the histogram template. When the histogram increases in size, it indicates a rise in momentum. Now, you could ask just how this can be used to spot a reversal in a trend. The answer is that when prices and indicators undergo movement in the opposite direction, it sparks off divergences. Since MACD is an indicator of momentum, it shows movement when a market trend is triggered. This is an extremely useful feature as it can help determine if a trend could close abruptly even though it is continuing at the present time.
- Relative Strength Index or RSI: This is a highly useful indicator to confirm reversal breakouts. Just like MACD, it creates divergences, spotting which in time can help predict likely trend reversals. In case you want to know how long a trend has been oversold or overbought, RSI is the right indicator. If the RSI value is over 70, the market is said to be overbought, and if it is 30, it is oversold.
- The Volume Indicator: Volume continues to be among the oldest and most popular day trading indicators. It helps to conduct volume analysis, which, in turn, helps to assess trend health. Volume-related tools, such as VWMA (Volume Weighted Moving Average), help with insights as well, for instance, when it distances itself from price action when there is a raise in volume.
Breakout trading is routine for swing and intraday traders, and is used by even highly successful automated systems. In a choppy market, breakout strategies help traders play safe and not worry too much about the long term.
Disclaimer
If you liked this educational article, please consult our Risk Disclosure Notice before starting to trade. Trading leveraged products involves a high level of risk. You may lose more than your invested capital.


