

Top 5 Strategies to Combat Forex Volatility
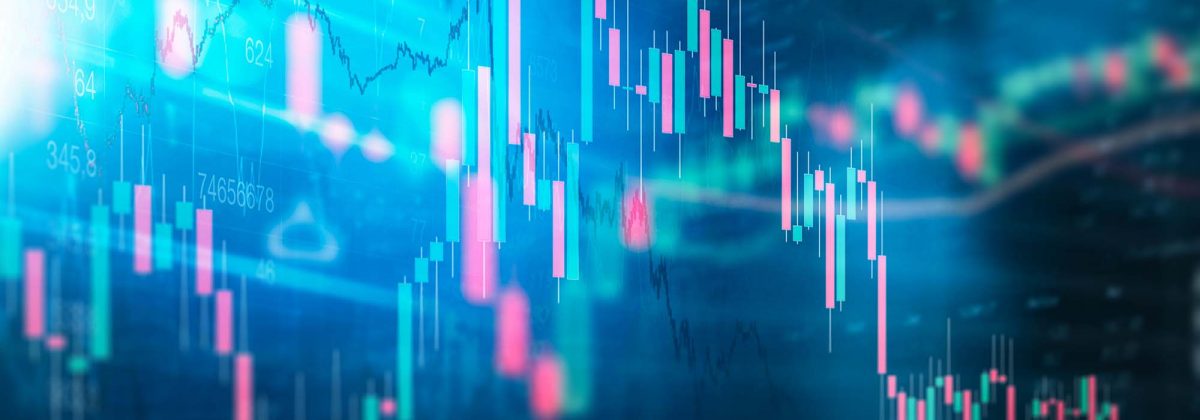
Volatility in forex trading is a measure of the range of sharp price changes and the frequency of these fluctuations over a certain period of time. It is measured in standard deviations. Currencies can be grouped in the high and low volatility categories, depending on how far their exchange rates deviate from the mean value. The most liquid currency pairs, such as the EUR/USD and USD/CHF, tend to experience low volatility, while cross pairs, like the AUD/JPY and GBP/JPY, or emerging market currency pairs, like the USD/RUB and USD/MXN, are known for their higher volatility.
Forex traders thrive on a certain amount of volatility in the markets, since this is what creates trading opportunities. Traders can enter positions where they buy a currency cheap and then sell it at a higher rate. In CFD trading, there are opportunities to derive trade from falling markets too, through short selling. Overall, it is all directed towards capturing the difference between the entry and exit prices.
But high volatility can be risky, if prices fluctuate downwards suddenly, causing huge losses. This is why experienced traders constantly work on their strategies to counter erratic market movements.
Here are some strategies that can help you deal with volatile market conditions.
Trading News Releases
Major announcements and breaking news releases can fuel volatility. Events like central bank interest rate decisions, major political events, natural disasters and speeches made by policy makers can cause large price swings. Knowing about these events beforehand can help traders stay prepared for price movements.
Traders could place a trade before the news event, using technical and fundamental analysis tools to make an educated guess on which direction the market might move in after the news release. Typically, analysts release their expectations regarding these events, which are important to consider, since the market is likely to price in these expectations.
If these expectations are not met, typically high price swings follow. For instance, the USD/JPY pair has a negative correlation with US economic releases. If reports like the US Non-Farm Payroll (NFP) signal a weaker US economy, the pair rises in value. Here, traders can use other economic indicators, such as Jobless Claims, Chicago Employment PMI, ADP Employment Change, and other pre-NFP report releases to make informed predictions regarding what the NFP might reveal.
If aggregating these releases points towards a bleaker economy, traders could consider short selling the USD/JPY pair, before the economic release. The NFP report is only one example. Traders can use an economic calendar to track upcoming news announcements and overall market expectations.
Using Charts and Indicators
Volatility indicators can help traders gauge market conditions and decide whether it suits their goals. These indicators can also serve other purposes, such as helping traders stay prepared for market reversals and identifying possible breakouts in range-bound conditions.
The Average True Range (ATR) is one such indicator, which measures how much an asset price moves within a certain time period. The value of the indicator moves up and down, depending on whether the price moves become larger or smaller throughout the day.
For instance, ATR levels are extremely high during market opening hours, when used on short-term intra-day charts like the 1-minute and 5-minute charts. After that, it mostly declines through the day. Traders can see the 1-minute ATR to find the level of price changes in the next 5 to 10 minutes. This could help establish profit targets and stop-losses.
Many traders use the ATR to set up a trailing stop-loss order, which helps to exit a trade when prices go against the trader and move the exit point when markets move in their favour. A common rule is to multiply the ATR by two, to place a stop-loss order below the entry point.
Other popular volatility indicators include the Parabolic SAR, Bollinger BandsⓇ, Commodity Channel Index (CCI) and Relative Strength Index.
The Need for Strong Money Management Strategies
When the average pip movements increase dramatically during periods of high volatility, traders need to consider the effect of leverage on their trades. A decrease in leverage is preferable when looking at potential losses of 100-200 pips. When the price fluctuates faster over larger ranges, smaller lot sizes could be considered when opening positions.
There are chances that traders could end up with the same level of gains with smaller lots, since large price swings could compensate for the small trading sizes. On the other hand, smaller lots could limit losses due to large price movements in an unfavourable direction.
The use of tighter stop losses is also useful, as is sound selection of currency pairs. It all depends on the assessment of the trader’s risk tolerance, which is the level of risk that one can comfortably bear psychologically and financially.
Trading Breakouts
There are times when prices move beyond resistance levels and below support levels. Once they break out of these levels, volatility increases and prices tend to move in the direction of the breakout. These trading set-ups indicate the start of future volatility increases and major price trends.
Breakouts take place in all market environments, although the most dramatic breakouts are channel breakouts, as well as price pattern breakouts, such as triangles, head and shoulder and flags. Volatility tends to decrease during such times, following which the price could move well beyond the identified range.
In order to trade breakouts, it is important to first identify the support and resistance levels. After this, check how many times the price touches these levels. The more times these levels are reached, the more valid or important the levels become. On the other hand, the longer the time that these levels are in play, the better the trading outcome is likely to be when the price finally breaks out.
Filling Market Gaps
When the forex market closes for the weekend, prices continue to move, based on global events, although this is not visible until Sunday at 5pm ET. This is what leads to market gaps. This is the region on the charts where price bars or candles jump from one position to a completely unrelated point, with nothing in between. Attempting to trade these market gaps could be one way to trade volatility. The market can sometimes move back to the price at which it closed on Friday evening.
While volatility can be exciting, traders usually avoid chasing the market. Objectivity is essential when trading in volatile conditions. Many traders neglect the adversities of a high drawdown on recoveries, which is why the 2% rule of not risking more than 2% of trading capital could be considered to tackle high risk environments.
Reference Links
- https://www.thebalance.com/how-average-true-range-atr-can-improve-trading-4154923
- https://www.investopedia.com/articles/forex/05/tradingonnews.asp
- https://www.investopedia.com/articles/trading/08/trading-breakouts.asp
- http://tradingmarkets.com/recent/5_steps_for_trading_in_forex_market_volatility-678828.html


