

Top 7 Candlestick Patterns Every Forex Trader Should Know
Trading knowledge that can directly translate into decision-making is an essential part of financial education.
Candlestick Patterns
Candlesticks are the most popular way of identifying price movements of currencies. They are similar to box plots, and display the open, high, low and closing price points for specific timeframes. They work because every candlestick includes a great deal of information that line or bar charts cannot furnish at a glance.
The top of the candlestick is the opening price, while the bottom is the closing price. The top wick shows the highest price for the duration under consideration and the bottom wick shows the lowest price. The difference between the opening and closing prices forms the body of the candle.
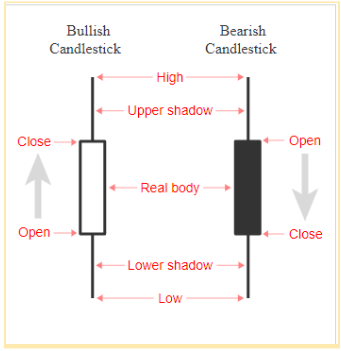
The above image shows the various parts of a candle stick. The filled body indicates that the close price was lower than the opening price (bearish movement), while the empty body indicates that the closing price was higher than the opening price (bullish movement).
Here are the top 7 patterns every forex trader must know.
- Doji
This candlestick pattern has an almost zero range between the open and close prices. However, the highest and lowest price points may be significantly far from each other. The Doji has 4 variants: traditional, long-legged, dragonfly and gravestone.
The Doji is a sign of indecision in the market. But when viewed alongside other candlesticks, it could indicate that buyers or sellers are gaining momentum for a continuation in trend.
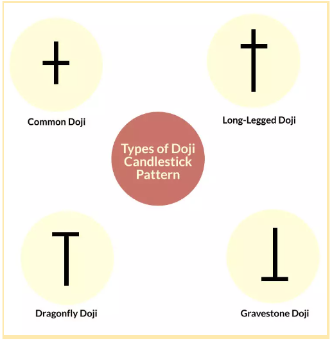
Trading a Doji
Using momentum indicators to confirm what a Doji is signalling is a common trading strategy.
- Hammer
A hammer is a short candlestick body with a long trailing wick indicating the lowest price, with some movement between the open and close prices. A hammer occurs at the bottom of a downward trend. The identifying characteristic of a hammer is that the lower wick is at least twice the size of the body of the candle. Hammers generally have no or negligible upper wicks.
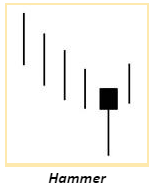
Trading with Hammer
A hammer is a trend reversal signal. That means a hammer indicates a rally. Most traders opine that whether the hammer is bearish or bullish is insignificant. A trader can enter a long trade with a stop loss below the hammer to achieve a positive risk-reward ratio.
- Shooting Star
A shooting star is the vertical mirror of a hammer. It occurs at the peak of an uptrend and consists of a candlestick with a long upper wick, implying resistance to further bullish movements. Most often, a shooting star is a bearish indicator. It signals an impeding downtrend.
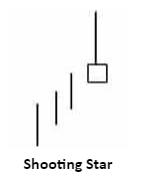
Trading with Shooting Star
A bearish candle next to a shooting star signals an entry point for traders willing to go short. Traders often place a stop loss above the upper wick of the shooting star candle. Take profit levels can be set at a previous support level to ensure a positive risk-reward ratio.
- Tweezers
Tweezers are two-bar reversal patterns. A tweezer occurs when two consecutive periods have the same support and resistance levels with very small wicks in the direction of the trend.
At the peak of an uptrend, a tweezer is formed by a bullish candle followed by a bearish candle. During a downtrend, a bearish candle is followed by a bullish candle.
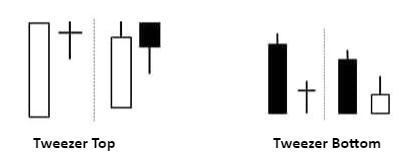
Trading the Tweezers
When the overall market is trending, a tweezer during a pullback is considered a signal to enter. A stop loss for a bottom pattern is placed below the tweezer lows and for a topping pattern, above the tweezer highs. Profit targets are determined by other market factors.
- Piercing Pattern
This is another two-candlestick pattern that indicates a bullish reversal. For a bearish market, a bearish candlestick is followed by a bullish candlestick. The second candle opens at a lower price but closes at a price above the middle of the previous candle. When a later candlestick crosses the high of the two, it is taken as confirmation of a trend reversal.
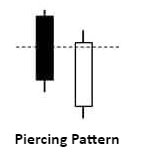
Trading a Piercing Pattern
Traders often open a long position after noticing the bullish candle and place a stop loss around its bottom.
- Dark Cloud
A dark cloud is the opposite of a piercing pattern. It is found at the peak of an uptrend and indicates a bearish reversal. A bullish candle is followed by a bearish candle. The top of the bearish candle lies above the top of the previous one but closes lower than the middle of the bullish candle. A confirmation, in this case, comes when a candlestick breaches the bottom of both candles.
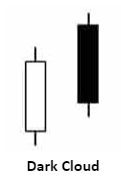
Trading a Dark Cloud
The close of the bearish candle is a sign for traders to exit their long positions. Forex traders tend to short after a dark cloud reversal is confirmed. The stop loss is placed above the high of the bearish candle. Take profit and exit points are identified using other indicators.
Traders need to focus on understanding trader psychology behind the pattern formation. A candlestick or a pattern only reflects the market sentiment. It is paramount that one understands that charts alone cannot accurately predict market movements. Hence, experienced traders remain vigilant about news updates and calendar events that may move the markets.
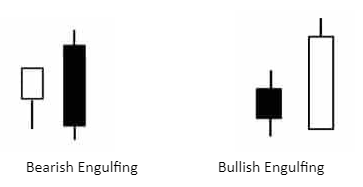
- Engulfing Patterns
An engulfing pattern occurs when a bullish candlestick completely engulfs a bearish one and vice versa. In this scenario, the high and the low of the first candle fall within the top and bottom of the second candlestick.
When a bullish candlestick is followed by a bearish one, it is considered a bearish engulfing pattern. This indicates increased activity of both bulls and bears in the market. Amid an uptrend, it indicates the onset of a bearish trend. However, in the case of an upward-trending market, its effect is generally unknown till another pattern is available for confirmation.
The case of a bullish engulfing pattern is the opposite of a bearish one. It indicates a trend reversal during a declining market.
Trading a Bearish Engulfing Pattern
The size of the bearish candle indicates the strength of the momentum. FX traders take short positions with a stop loss just above the top of the two candlesticks.
Trading a Bullish Engulfing Pattern
After pattern confirmation, traders tend to go long, with a stop loss below the low of the two candlestick patterns.
To Sum Up
- Candlestick patterns are a popular way to monitor price action in forex trading.
- Forex traders may use single, double, or multiple candlesticks to develop a trading strategy.
- Trading decisions are not made by candlestick patterns alone. Other market-moving factors are also taken into account for informed decision making.
Disclaimer:
All data, information and materials are published and provided “as is” solely for informational purposes only, and is not intended nor should be considered, in any way, as investment advice, recommendations, and/or suggestions for performing any actions with financial instruments. The information and opinions presented do not take into account any particular individual’s investment objectives, financial situation or needs, and hence does not constitute as an advice or a recommendation with respect to any investment product. All investors should seek advice from certified financial advisors based on their unique situation before making any investment decisions in accordance to their personal risk appetite. Blackwell Global endeavours to ensure that the information provided is complete and correct, but make no representation as to the actuality, accuracy or completeness of the information. Information, data and opinions may change without notice and Blackwell Global is not obliged to update on the changes. The opinions and views expressed are solely those of the authors and analysts and do not necessarily represent that of Blackwell Global or its management, shareholders, and affiliates. Any projections or views of the market provided may not prove to be accurate. Past performance is not necessarily an indicative of future performance. Blackwell Global assumes no liability for any loss arising directly or indirectly from use of or reliance on such information herein contained. Reproduction of this information, in whole or in part, is not permitted.


