

Trading the Ichimoku Cloud Like A Pro
Popularised by Goichi Hosoda, Ichimoku Kinko Hyo or the Ichimoku Cloud is a leading price action indicator. Hosoda took 30 years to practice and perfect this technical analysis tool before sharing it with the world. It is presented in sophisticated candlestick charts with colour-coded components. The Japanese indicator informs traders about momentum direction, volatility, key support and resistance levels, and potential reversals.
Due to multiple data points, it provides more reliable insights into price action, helping traders make informed decisions. It applies to diverse instruments across time-frames, which makes it a valuable addition to any trader’s toolkit.
The Ichimoku Cloud Indicator
The Ichimoku Cloud indicator has multiple components. Broadly, it uses various averages and plots them on the price chart to identify and predict support and resistance zones. The 5 curves that form different areas are listed below with their default settings:
1. Tenken Sen
Also called the conversion line, Tenken Sen is plotted on the price chart as a 9-period moving average of the price in blue. This standalone line is primarily used to spot crosses with the Kijun Sen, called TK crosses.
Tenken Sen = 9PH + 9PL / 2
PH = Period High
PL = Period Low
2. Kijun Sen
Kijun Sen is the 26-period moving average of the price, also known as the baseline. The baseline is shown in red on the chart. It determines the support and resistance levels in bull and bear markets, respectively.
Kijun Sen = 26PH + 26PL / 2
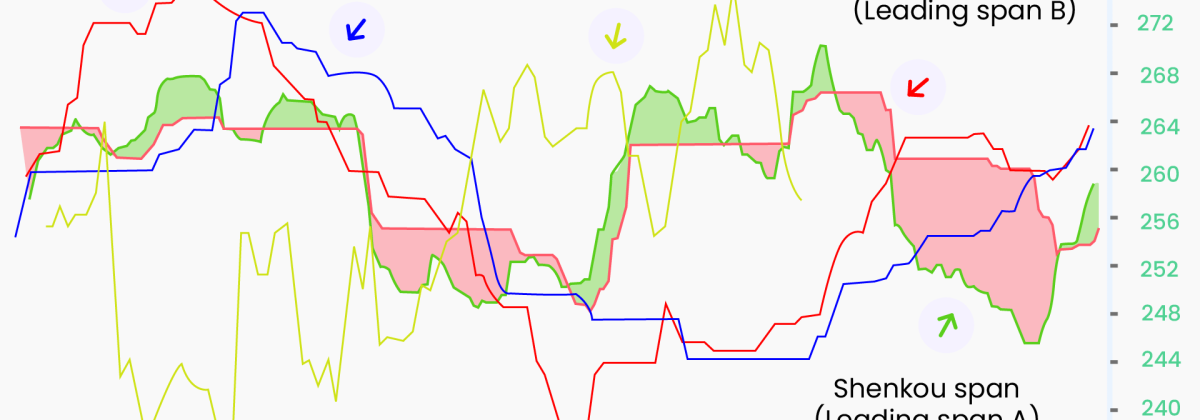
3. Senkou Span A
This is the moving average of the conversion line and the baseline projected 26 periods ahead. It is also called Leading Span A and is plotted in green.
Senkou Span A = CL + BL / 2
BL = Base Line
CL = Conversion Line
4. Senkou Span B
Also called Leading Span B is a 52-period moving average of the price, projected 26 periods ahead on the price chart. It is plotted with brown by default.
Senkou Span B = 52PH + 52PL / 2
5. Chikou Span Line
This is the closing price of the current period, projected for 26 periods in the past. It is plotted as a grey line. Due to projections in the past, Chikou Span is also called a Lagging Span.
Chikou Span = Close plotted 26 periods in the past
These default settings of the Ichimoku indicator are stated as 9/26/52/26. However, traders can adjust these settings for different instruments and diverse market conditions.
Key Areas on the Ichimoku Chart
Kumo Cloud
Senkou Span A and Senkou Span B are edges of the Kumo Cloud. The two lines represent support when the price is trending above the cloud and resistance when it is trending below the Kumo cloud.
Kumo Twist
The colour of the Kumo cloud changes when Span A and Span B cross. This is known as a Kumo Twist. As the most basic rule, a transition to green indicates buy, and a transition to red indicates sell for traders.
Chikou Span
The Chikou Span helps traders find the relationship between current and past price movements. It is used to confirm trend continuations and spot potential reversals.
When the Chikou Span line is above the current price, it signals a continuation of the uptrend. Likewise, the Chikou Span line signals a sustained downtrend when it lies below the current price.
A bearish reversal is signalled when the Chikou Span line falls below the current price during an uptrend and vice versa for a bullish reversal.
Trading the Ichimoku Cloud
The Ichimoku Cloud packs a lot of information and generates numerous signals. Therefore, traders use many strategies to trade with the Ichimoku Cloud indicator.
Kumo Cloud Breakout Strategy
A bullish breakout occurs when the price breaks the Kumo cloud upwards. It is considered a signal to buy. To confirm the signal, traders verify that the conversion line crosses the baseline upwards, i.e., an upward TK cross occurs. Simultaneously, they look for a bullish bias, indicated by the lagging span trending above the price.
Conversely, a sell signal is generated when the price breaks out of the Kumo Cloud downwards. It is indicated by the conversion line crossing the baseline downward and confirmed by the lagging span signalling a bearish bias.
Kumo Edge-to-Edge Strategy
This setup occurs when the price breaks into the cloud and the candlesticks start closing.
In the case of a bull market, this means the cloud is above the price and candlesticks start closing (ending) in the cloud. The upper edge of the cloud becomes the target price, forming a good zone to exit long positions.
In contrast, during a bearish scenario, the candlesticks close within the cloud that is below the price, and the lower edge becomes the target price. This is a signal to close short positions.
Using Ichimoku as an Oscillator
Oscillators help traders to identify overbought or oversold markets. Traders identify impending market corrections by establishing the correlation between the Tenken Sen and Kijun Sen lines. When the gap between the two widens significantly, the market is considered ripe for a correction.
Limitations of Ichimoku Indicator
With so much information packed together, the indicator can be intimidating for beginners. Make sure you practice on a demo account to familiarise yourself with setting the parametres according to your markets of interest, discovering signals and making trading decisions in line with your trading strategies.
The chart combines three indicators and offers a filtered approach to price action. However, no indicator can be a sure-fire predictor of market movements. Like any technical indicator, signals generated by Ichimoku should also be confirmed with another indicator.
To Sum Up
- The Ichimoku Cloud indicator packs a lot of information with 5 types of curves plotted on the price chart using moving averages of different periods.
- The Ichimoku Cloud is used to identify and confirm trends, predict reversals and discover support and resistance zones.
- Popular Ichimoku trading strategies include the Kumo Cloud BVreakout, Kumo Cloud Edge-to-Edge and using the Ichimoku indicator as an oscillator.
Image source: https://blog.streak.tech/ichimoku-cloud/
Disclaimer:
All data, information and materials are published and provided “as is” solely for informational purposes only, and is not intended nor should be considered, in any way, as investment advice, recommendations, and/or suggestions for performing any actions with financial instruments. The information and opinions presented do not take into account any particular individual’s investment objectives, financial situation or needs, and hence does not constitute as an advice or a recommendation with respect to any investment product. All investors should seek advice from certified financial advisors based on their unique situation before making any investment decisions in accordance to their personal risk appetite. Blackwell Global endeavours to ensure that the information provided is complete and correct, but make no representation as to the actuality, accuracy or completeness of the information. Information, data and opinions may change without notice and Blackwell Global is not obliged to update on the changes. The opinions and views expressed are solely those of the authors and analysts and do not necessarily represent that of Blackwell Global or its management, shareholders, and affiliates. Any projections or views of the market provided may not prove to be accurate. Past performance is not necessarily an indicative of future performance. Blackwell Global assumes no liability for any loss arising directly or indirectly from use of or reliance on such information herein contained. Reproduction of this information, in whole or in part, is not permitted.


