5 Technical Indicators for Trend Trading
Even at the best of times, the stock market seems chaotic. But, in 2020, we aren’t witnessing the best of times at all. As a result of the coronavirus pandemic, the global stock markets have witnessed the greatest levels of uncertainty since the Great Depression of the 1930s.
In March, the CBOE volatility index surged more than 50 points to peak at 82.69. This surpassed even the peak level of 80.74, reached during the 2008 economic crisis. Although the volatility levels have since dropped from the peak levels seen in March, they still remain above 25. This is alarmingly high. Experts at Goldman Sachs believe that this volatility is here to stay at least until the end of 2020.
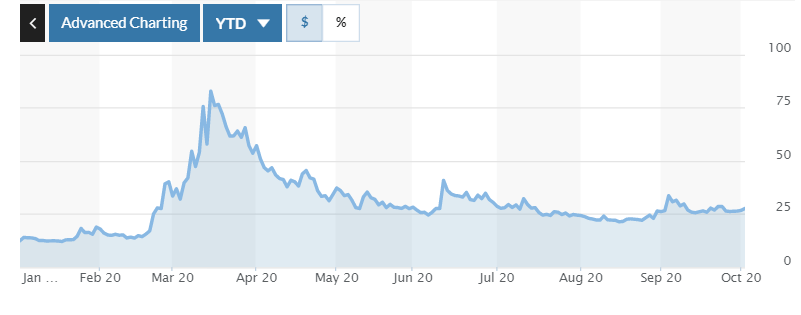
CBOE Volatility Index. Source: MarketWatch
But even during all this uncertainty, there are patterns and trends that form and can be used to identify trading opportunities. This is what trend trading is all about. It attempts to identify trades by analysing the movement of an asset’s price in a particular direction. However, trend trading requires informed decision making, using the right technical analysis tools. So, here’s a look at the 5 most popular technical indicators traders use to trade the trend.
1. Moving Averages
As the name suggests, moving averages is a technical analysis tool that constantly updates the average price of an asset over a period of time. It creates a smooth, single, flat line that removes any variations caused by random price fluctuations. The price average is determined for a specific timeframe. This could be 10 days, 20 days, 25 weeks or any other timeframe the trader chooses. For long term trend followers and investors, 50-day, 100-day and 200-day MA are the most popular choices.
There are multiple ways you can use moving averages. One of them is monitoring the angle of the MA line. If the line is moving upwards, it signals an uptrend in price. However, it must be noted that MA is a lagging indicator. This means that it does not help forecast future price movements. Instead, it reveals how the price is moving on average, during a specific timeframe.
Another way to use MA is through crossovers. In this case, when the price rises above the MA line, it is considered a signal to buy. Similarly, when the price moves below the MA line, it indicates a sell signal. The drawback of this method is that it can also produce false signals. This is because the price is much more volatile than MA. This is shown in the figure below.
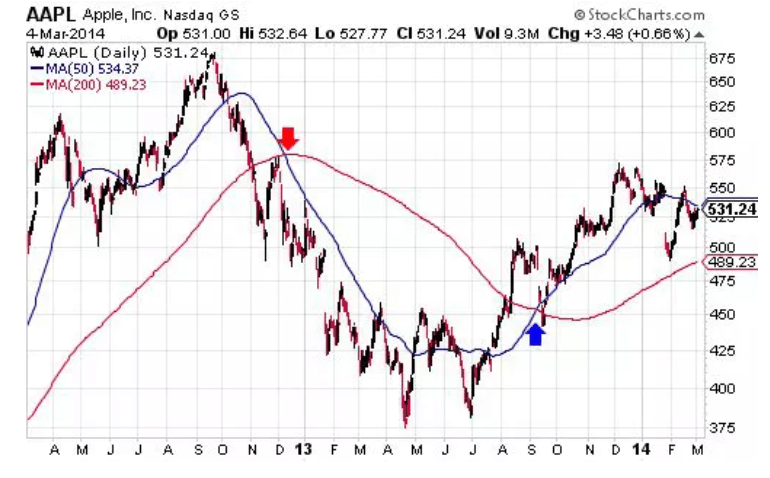
Source: Investopedia
2. Relative Strength Index
The relative strength index is a momentum indicator that identifies oversold and overbought conditions in the market. It has a scaled line, ranging from 0 to 100. If the reading is above 70, it points towards an overbought market, while readings below 30 indicate an oversold market. When using RSI, the idea is to take action when the market is reversing. Here, traders tend to buy when the trend is moving upwards in an oversold market. Similarly, when an overbought market is moving downwards, traders prefer to sell.
3. On-Balance Volume
OBV uses a large amount of volume information, which is then compiled into a single line indicator. OBV measures the cumulative selling and buying pressure of an asset. This is done by subtracting the volume on “down” days and adding it on the “upward” days. Under ideal conditions, the trends should be confirmed by the volume. When the price is rising, it should be accompanied by an increasing OBV. Similarly, with the price falling, there should be a decline in the OBV.
But in some cases, the OBV might rising even if the price isn’t. Then, there could be times when the price follows the OBV line, only to rise in the future. In case the price is increasing, but the OBV is horizontal or falling, the price might be near its peak. If the price is declining but the OBV is increasing or flat lining, then the price could be near its lowest point.
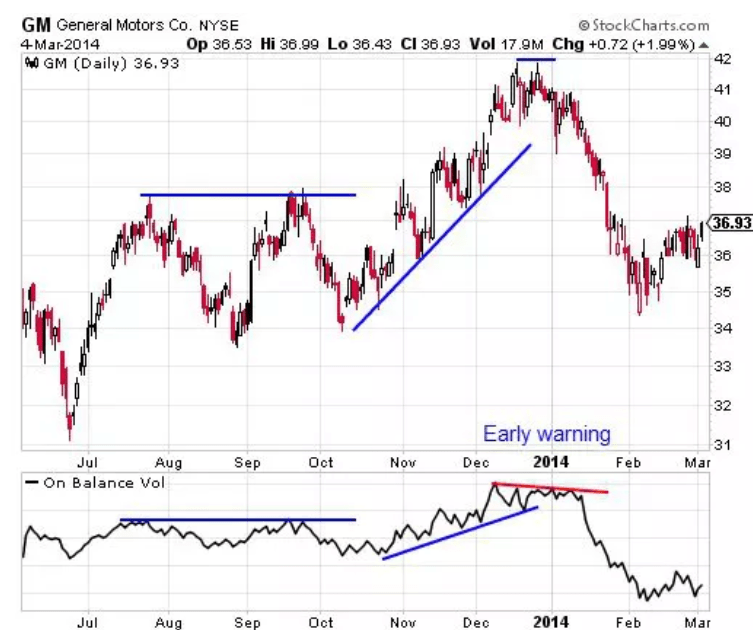
Source: Investopedia
4. Moving Averages Convergence Divergence
Moving averages convergence divergence (MACD) is a type of moving oscillator that fluctuates around 0. It is both a momentum and a trend following indicator. With MACD, the strategy is to look at which side of 0 the MACD line is forming. If for a sustained period, the MACD lines are over 0, then it indicates an upward trend. On the other hand, if the lines are below 0 for an extended period, then the trend is likely to move downwards.
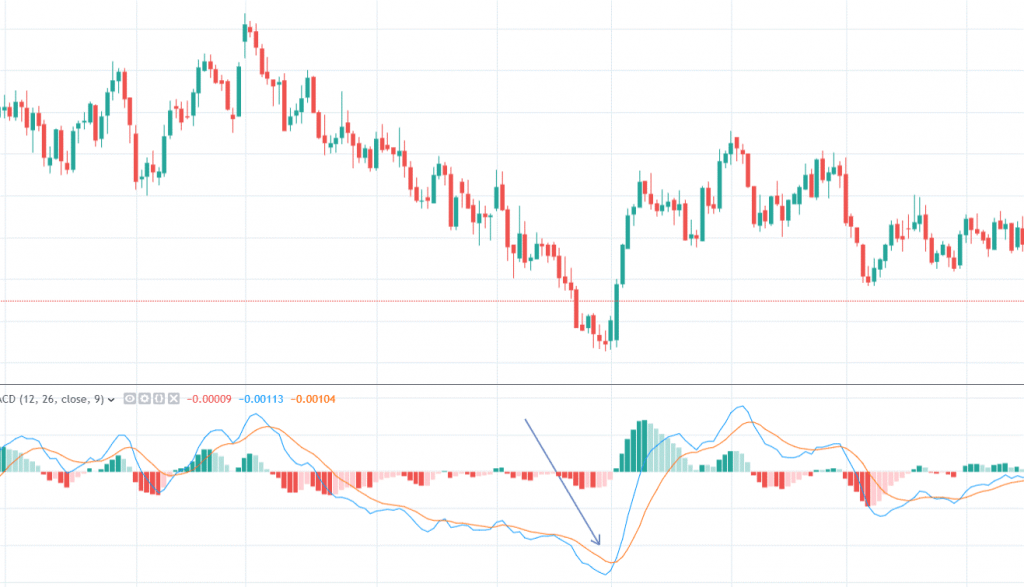
Source: The Robust Trader
Using this, a potential buy signal could be when the MACD lines become greater than 0. When the MACD line crosses 0 on a downward slope, it can be a sell signal.
5. Bollinger Bands
Bollinger Bands indicate volatility. They can be used in both trending and ranging markets. They consist of an MA line and 2 more lines, plotted at 2 standard deviations on either side of the central line. This creates a band. The edge of the band follows the asset price and reflects its volatility. When the band moves closer, it reflects low volatility. In case volatility increases, the standard deviation lines would be at a greater distance from the central MA line.
It is important to remember that no technical indicator can guarantee successful trades. But in a volatile market, they can certainly help improve the chances of success.


