How to Trade Triangle Chart Patterns

Triangle chart patterns are one of the best ways to visually represent the battle between the bulls and the bears. This technical analysis tool is considered on of the most reliable, and most popular tools. This is especially so as it highlights post-pattern signals much faster than other tools.
This continuation pattern is great at indicating bearish or bullish markets. The pattern is formed when the market continues on a sideways trading pattern. This causes the tops and bottoms of the price action to converge, forming a triangle. In other words, lower highs and higher lows come together in the shape of a triangle, so that the support and resistance lines converge at a point.
While the triangle’s shape is important, the direction in which the market moves after it breaks out of this shape is even more important. There are 3 types of triangle patterns, symmetrical, ascending and descending triangles. Here’s a look at what each one signifies.
Ascending Triangle Pattern
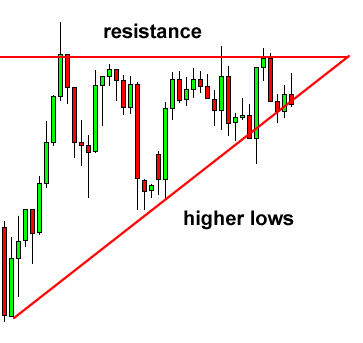
Most of the times, the ascending triangle is a bullish pattern. This means that the price of an asset is likely to rise as the pattern completes itself. This pattern is created using 2 trendlines. The first trendline is flat at the top and acts as the resistance level. The horizontal line is drawn along the swing highs. The highs do not need to be the same height, but do need to be close to each other.
Once the price point rises above it, the beginning of an uptrend is signalled. The bottom trendline shows the support level. It is drawn along the climbing swing lows. At least 2 swing lows and 2 swing highs are required to create an ascending triangle pattern. But more reliable results can be achieved with a higher number of trendline touches.
Source: Babypips
How an Ascending Pattern Can Help You
The ascending pattern may fail to breakout multiple times. But this does not mean that sellers have more power. This can be seen by the fact that after each sell-off, when the price touches the resistance level, it stops at a slightly higher level than the last time the price hit resistance.
Eventually, the price could break through this resistance line and continue on an upward trend. This is where traders tend to take a buy position. It must be remembered, however, that the trading volume should be high to confirm the breakout. If the price quickly moves back into the triangle, it is a false breakout.
Descending Triangle Pattern
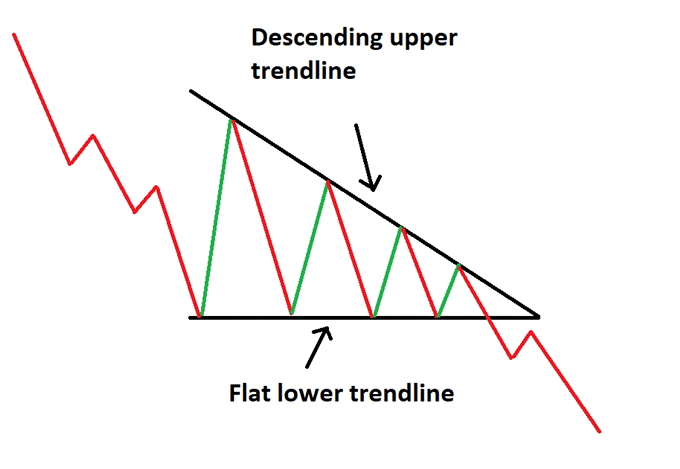
As the name suggests, a descending triangle pattern is the exact opposite of an ascending one. This pattern often suggests a bearish signal. This means that the price of an asset is expected to continue to slide as the pattern completes itself. The descending pattern has a downward angled trendline, formed by a series of continuously declining highs. The bottom line or support is horizontal and is formed by connecting a series of lows. The lows do not need to be exactly equal, but similar in value.
Source: DailyFx
How a Descending Pattern Can Help You
This pattern is formed when the price point of an asset experiences a series of declines. However, after it rebounds from each fall, the high is lower than the previous high. This tells us that the demand for the asset is gradually weakening. Once the price falls below the horizontal support line, it indicates that the downward momentum is only going to continue. This presents traders with short-term trading opportunities.
During the downward breakout, traders can take a short position. They can also place a stop loss order slightly above the highest price achieved during the formation of the triangle.
Symmetrical Triangle Chart
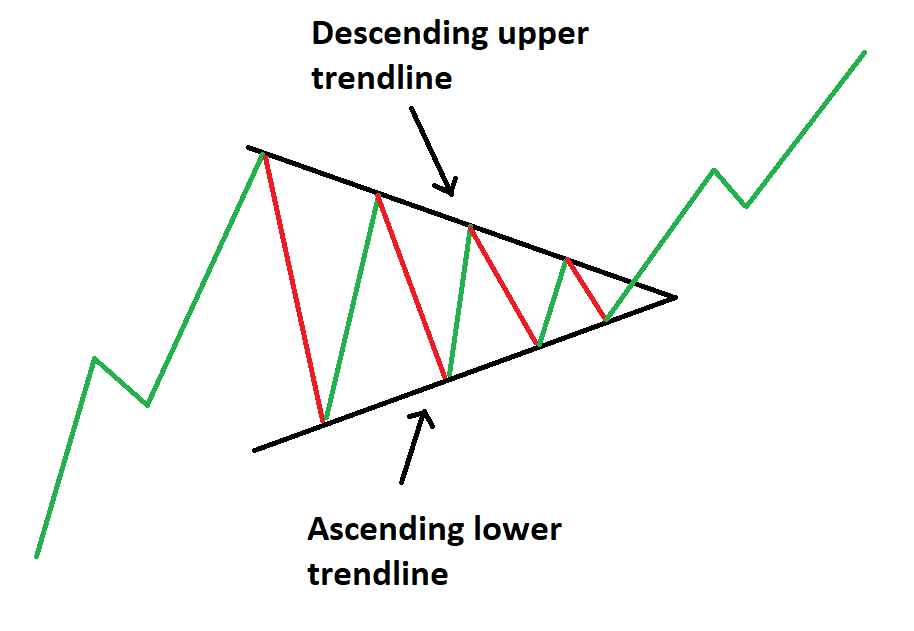
Unlike the previous 2 triangle patterns, the symmetrical triangle does not contain a horizontal trendline. Instead, this pattern is formed when gradually a sliding resistance line ends up meeting a slowly rising support line. The 2 lines connect a series of troughs and peaks. The lines should have roughly equal slopes. Trend lines that converge at unequal angles would fall into the ascending or descending angle category.
Source: Investopedia
How a Symmetrical Pattern Can Help You
The price of the asset bounces back and forth between the 2 trend lines in a symmetrical triangle pattern. In this period, there is extreme indecisiveness, and it might be difficult for traders to take a position. This continues until the lines converge. At this point, a breakout could occur in either direction, up or down, forming a sustained trend. Most of the times, the breakout occurs in the direction of the existing trend. When such a breakout occurs, traders can open a position.
This triangle chart pattern also provides easy identification of stop loss levels. The stop loss level in the symmetrical pattern is just above the triangle for short positions, and slightly below the triangle for long positions.
Triangle chart patterns are a great way to estimate the interest in a trading instrument. But like most other forms of technical analysis, they provide best results when used along with other chart patterns and technical indicators.


