

Understanding Bollinger Bands and Their Uses
Bollinger Bands® are a type of technical analysis tool that is plotted on a statistical chart. They show the volatility and prices associated with a commodity or a financial instrument over a period of time. This tool was developed and copyrighted by famous technical trader, John Bollinger, in the 1980s. Today, numerous participants of the financial markets, including forex traders, use them to conduct sound technical analysis and make informed trading decisions.
Given that currency traders are always on the lookout for incremental moves to enter positions, identifying a change in the trend and volatility becomes extremely important. Both these aspects can be analysed with the help of Bollinger Bands®.
Here’s what you should know about this indicator.
How are They Calculated?
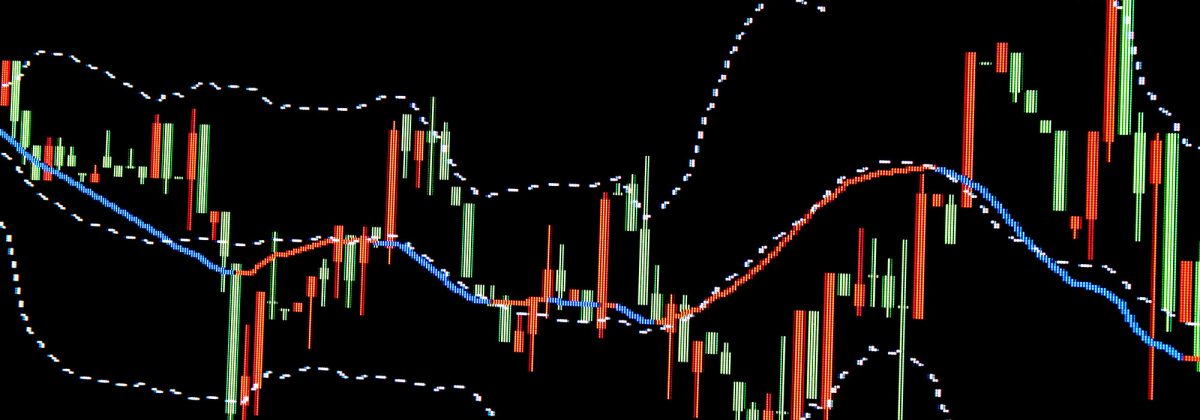
Bollinger Bands® consist of three main lines or bands, the upper, middle and the lower band. The upper and lower bands are two standard deviation values (usually from a 20-day simple moving average), and the middle band is the simple moving average. The lines follow the concept of a volatility channel.
To calculate the three bands, follow the steps below:
- First, find the simple moving average (SMA) of the financial instrument, commodity or currency you are interested in. Typically, a 20-day moving average is computed, since it can average out the closing prices of a currency for its first 20 days. This acts as the first data point on the chart. The successive data point will drop the earliest price, add the price of the 21st day, and then calculate the average. This process is repeated for every data point.
- Next, calculate the standard deviation of the currency under consideration. In a general sense, standard deviation is a quantitative measure of the average variance and is popularly used in statistics, accounting, finance and economics. You can calculate it by finding out the square root of variance, which in turn, is the average of the squared differences of the mean.
- After this, multiply the standard deviation value by two and add this new value to each data point present on the SMA line. This will give you the upper band. For the lower band, subtract the new value from each data point.
What Do Bollinger Bands® Indicate?
Bollinger Bands® have become a popular tool due to the various signals they offer traders. A number of traders believe that the greater the proximity of prices to the upper band, the more overbought the market, and greater the proximity to the lower band, the more oversold the market.
Apart from this, there are other specific indications that can be derived from Bollinger Bands®, such as:
- Reversal or continuation of trends
- Periods of potential market consolidation
- Upcoming periods of large volatility breakouts
- Possibility of market tops, bottoms and estimated price targets
A very important part of volatility estimation is the occurrence of squeeze in the chart.
The Idea of Squeeze
This is the core concept of Bollinger Bands®. When the upper and lower bands come close together and constrict the moving average line, this condition is known as a squeeze. This is seen as a signal for a period of low volatility and shows that there is a potential for increased volatility in the future, leading to a possibility of greater trading opportunities. On the contrary, if the bands move apart, there is a chance of a decrease in volatility and potential for exiting a trade.
However, these conditions cannot be taken as trading signals, since they give no indication of when a change might take place or the specific direction in which the price might move.
Limitations of Bollinger Bands®
Bollinger Bands® cannot be considered as a standalone technical analysis tool. They were designed with the aim of giving traders information about price volatility. It is, therefore, best to use them along with two or three other independent indicators, so that you can get more specific market signals. Indicators that use different types of data include on-balance volume and Relative Strength Index (RSI).
Another limitation is that since Bollinger Bands® are calculated from simple moving average, they consider old price data in a similar manner as the most recent data. This means there is a possibility of the new data being overshadowed by the obsolete data.
Lastly, the use of a 20-day simple moving average and two standard deviations is a little arbitrary and may not necessarily be useful in every situation. So, it is wise to make suitable adjustments to your SMA and standard deviation values and monitor them regularly.
Tips on Using Bollinger Bands®
At times, the reactions of the bands are not very intense, and you might miss out on potential profits if you set your orders directly on the upper and lower bands. This is why traders usually set exit and entry points near these bands, rather than on them, to avoid chances of disappointment.
Another strategy that you could use is to add a second set of Bollinger Bands®. These can be placed a single standard deviation away from the simple moving average, leading to the creation of upper and lower channels. So, sell orders can be placed in the upper area and buy orders in the lower area, to increase the chances of success.
There are many other strategies that are used in forex trading along with Bollinger Bands®, such as Pure Fade Trade and Day Bollinger Band Turn Trade. Theoretically, these are all ways to improve chances of profits, but it is best to use them tempered with your own estimations, knowledge of the market and detailed technical and fundamental analysis.
The main point here is that Bollinger Bands® can be used as a supporting tool to help you in identifying opportunities in the market that can increase the probability of success.


