

What is the Volatility Index and How Does it Help Read Market Sentiment?

Fear and greed are the two primary emotions that influence trading decisions. Market sentiment is the cumulative result of the general outlook of market participants, which comes from these two emotions. They correspond with bullish (greed) and bearish (fear) outlooks. Quantifying market sentiment can help traders predict market direction. This is what the volatility index or VIX does by measuring fear in the market. Here’s what you need to know to trade using the VIX.
The VIX (Fear) Index
The VIX is calculated by the Chicago Board of Options Exchange (CBOE) to indicate the implied volatility of S&P 500 options. It is a contrarian indicator of the stock market. The VIX sets the volatility expectation for the next 30 days. Volatility is also an indicator of the risk associated with the price movement of an asset. The VIX tends to be inversely correlated with the S&P 500.
Notably, the volatility index is associated with a benchmark index and there is no generic indicator that can be used across all indices or for all exchanges. Therefore, in addition to the VIX, the CBOE has created the DJIA Volatility Index (VXD) and CBOE NADSAQ-100 Volatility Index (VXN), which are used similarly to the VIX.
Why Gauge Fear in the Market?
Emotions drive market activity and generate opportunities for traders. In the first quarter of 2023, the collapse of Silicon Valley Bank led to a decline in the share prices of multiple regional banks. This happened because traders withdrew their investments in banking stocks out of fear of failure of a banking crisis. This caused a ripple effect, taking multiple banks down. If traders had not gotten scared, banking stocks may have remained stable. But market participants lost faith in the banking system which rippled out causing a larger bank crisis. This is how fear sometimes proves to be a self-fulfilling prophecy. Amid the major sell-off, some might have “seen it coming” while others just shorted their shares out of herd mentality.
Therefore, gauging fear is essential, and that too at the earliest, to get the first mover advantage. By riding the market trend when sentiment is at play, getting in on the action early can prove beneficial.
Interpreting VIX
Traditionally, institutional investors have better access to market updates and resources to predict market movements correctly. Therefore, retail traders tend to follow their strategies in the options markets to gauge sentiment-based trends.
If institutional investors predict that one or more of their holdings is going to lose value, they hedge via put contracts. This is because they have a large amount of assets and cannot just sell them all off instantaneously. This induces volatility and the VIX rises.
High VIX
A rising VIX indicates that volatility is increasing due to fear and panic. Once it has reached a peak, i.e., implied volatility is extremely high, it indicates that market participants are extremely bearish. It is likely that the market has bottomed out. This is when the VIX will correct to the mean and a bullish reversal could take place.
Low VIX
When volatility has bottomed, the market is also said to have reached its peak and is about to reverse. As a result, market sentiment is about to become bearish, stimulating volatility, which will push the VIX to the mean.
Traditionally, the volatility index ranges between 18 and 35. However, it has had breakouts beyond this range, down to 10 and up to 85.
Although the VIX directly signals sentiment in the stock market, it can be used for other assets as well. This is because when high-risk assets, such as equities, are heavily traded, the trading volume in safe haven assets declines.
An Example
During the Covid-led bear market of 2020, the VIX had reached 85.47 while the S&P 500 declined by 12%. That is also when all segments of the US financial market plummeted. After such panic, there is always a follow-through day, when traders tend to buy as the markets have bottomed and a reversal is due. For the Nasdaq, the VIX top was a signal of an impending bull run in the next 20 days, which pushed it 7.3% higher than the previous day.
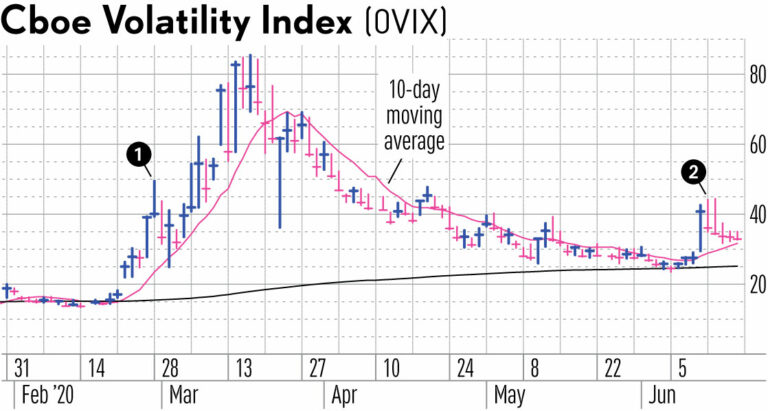
Research shows that a 20% spike in the VIX, above its 10-SMA line, is a confirmation of a positive market reversal.
When the VIX and S&P 500 Decouple
This happens when the sentiment of smaller market players impacts the decision of larger market players. At certain times, institutions end up believing that the market is oversold, while retail traders act out of panic. This volatility triggers institutions to hedge too early, despite the asset having more upside potential, which eventually causes the uptrend to reverse early.
The VIX is usually not used alone. Since the volatility index is solely dependent on the equities market and only takes into account the behaviour of market players, traders confirm their decisions with stronger analysis techniques. Market analysis is incomplete without more price action-based technical indicators. A combination of technical indicators that consider past price movements and VIX to understand future implied volatility is a popular trading strategy.
Combining the VIX with the Relative Strength Index (RSI) is a popular trading strategy explained by Larry Connors, in his book on volatility trading. It is a mean reversal strategy that uses the RSI to gauge whether the market is overbought or oversold and the VIX to identify whether it is ready for a reversal.
Another aspect to keep in mind is that the VIX gives both buy and sell signals, which means it does not consider the direction of volatility. This re-emphasises the need to combine it with another indicator for confirmation.
To Sum Up
- VIX is a quantification of volatility in the S&P 500, most often due to trades initiated by institutional investors.
- When the VIX is high, it will eventually correct towards the mean.
- The same is true for when the VIX is low.
- Experts recommend using the VIX as a secondary indicator to confirm a reversal and not to identify equity market bottoms.
Disclaimer:
All data, information and materials are published and provided “as is” solely for informational purposes only, and is not intended nor should be considered, in any way, as investment advice, recommendations, and/or suggestions for performing any actions with financial instruments. The information and opinions presented do not take into account any particular individual’s investment objectives, financial situation or needs, and hence does not constitute as an advice or a recommendation with respect to any investment product. All investors should seek advice from certified financial advisors based on their unique situation before making any investment decisions in accordance to their personal risk appetite. Blackwell Global endeavours to ensure that the information provided is complete and correct, but make no representation as to the actuality, accuracy or completeness of the information. Information, data and opinions may change without notice and Blackwell Global is not obliged to update on the changes. The opinions and views expressed are solely those of the authors and analysts and do not necessarily represent that of Blackwell Global or its management, shareholders, and affiliates. Any projections or views of the market provided may not prove to be accurate. Past performance is not necessarily an indicative of future performance. Blackwell Global assumes no liability for any loss arising directly or indirectly from use of or reliance on such information herein contained. Reproduction of this information, in whole or in part, is not permitted.
