

10 Candlestick Patterns Every Trader Must Master
Little did Munehisa Homma know that he was pioneering a trading tradition when he started using candlestick patterns for rice trading in the 18th century. Steve Nison introduced them to the world through his book, Japanese Candlestick Charting Techniques, in 1991. Candlestick patterns have become a trader’s go-to technical analysis tool since then due to their ease of use. This article covers the top 10 multi-candle patterns a trader can master to develop an effective trading strategy.
Candlesticks: A Refresher
Here’s a quick look at the detail-packed candlesticks
Image: Components of a candlestick
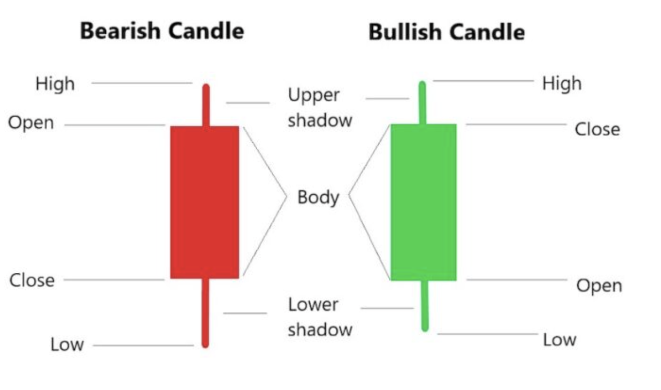
Image Source: https://learn.bybit.com/candlestick/best-candlestick-patterns/
Remember that in black-and-white charts, the bearish candle is white (unfilled) and the bullish is black (filled).
Top 10 Multi-Candle Patterns
- Morning Star
This is a 3-candlestick bullish reversal pattern, where the first is a bearish candle, followed by a spin-top Doji and the last is a bullish candle. The body of the bullish Doji lies completely outside that of the surrounding candles, indicating market indecision. The closing price of the bullish candle is higher than the opening price of the last bearish candle.
Image: Morning Star
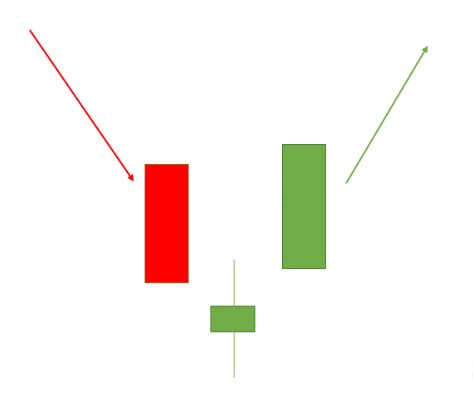
Image Source: https://blog.elearnmarkets.com/35-candlestick-patterns-in-stock-market/
- Evening Star
The evening star candlestick pattern indicates a bearish reversal at the end of an uptrend. The pattern is formed when a bullish candlestick is followed by two bearish candles. The first is the spin-top Doji, with its body completely outside that of the bullish and bearish candles, indicating indecision in the markets. The following bearish candle, outside the body of the Doji, has a long body with closing price lower than opening price of the last bullish candle.
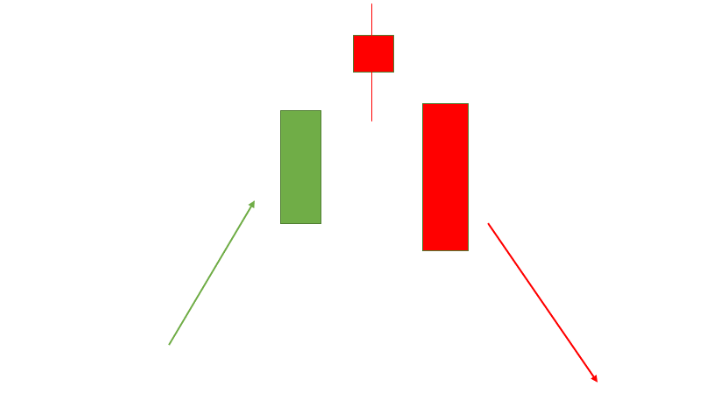
Image Source: https://blog.elearnmarkets.com/35-candlestick-patterns-in-stock-market/
- Head and Shoulders Pattern
The head and shoulders pattern is a complex multi-candlestick pattern. It indicates a bearish reversal after an uptrend. It is one of the most popular patterns. The pattern is formed when the price makes three peaks above a neckline. The neckline is the support level. The first (left shoulder) and the third (right shoulder) peaks are similar in height to each other, while the second peak (head) is much higher than the shoulders. The pattern indicates attempts of the bulls to sustain the uptrend for longer. The last peak is followed by the price falling below the neckline and confirms trend reversal.
Image: Head and Shoulders
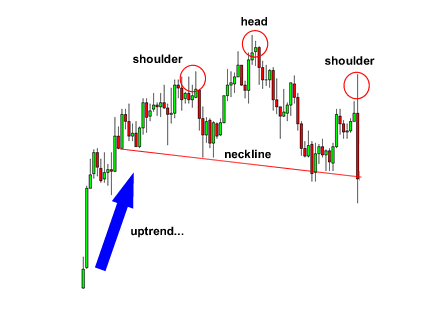
Image Source: https://www.babypips.com/learn/forex/head-and-shoulders
- Inverse Head and Shoulders Pattern
The inverse head and shoulders pattern indicates a bullish trend reversal. It is characterised by a neckline with three valleys. The first and the third valley (left and right shoulders) are almost at the same level, while the second valley (head) is much deeper than the two. The middle valley indicates weakening strength of the bears to sustain the downtrend. When the price rallies above the neckline after the second shoulder, it indicates the beginning of an uptrend.
Image: Inverse Head and Shoulders
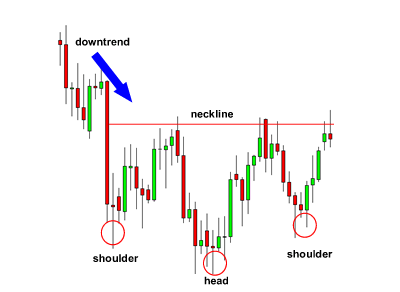
Image Source: https://www.babypips.com/learn/forex/head-and-shoulders
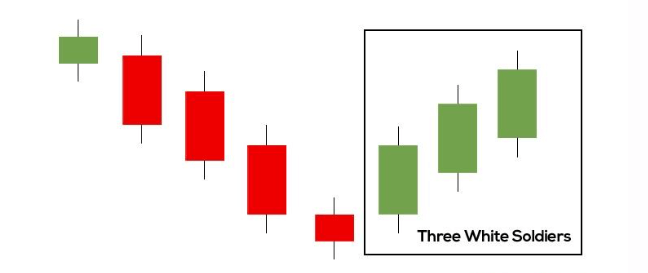
- Three White Soldiers
This is another 3-candlestick trend reversal pattern. It indicates a bullish reversal after a sustained downtrend. The pattern can be identified when a bearish candlestick is followed by three long bullish candlesticks, each making a higher high than the previous one.
Image: 3 White Soldiers
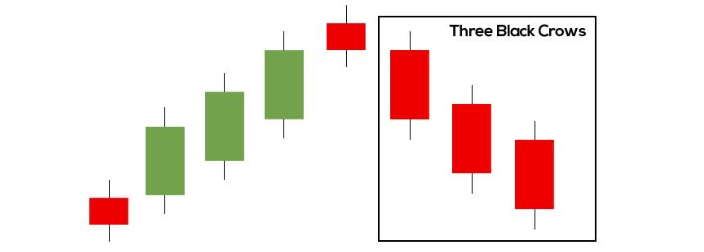
- Three Black Crows
Three black crows indicate a bearish reversal. The pattern occurs when a bullish candle is followed by 3 bearish candles, each making lower lows. The red candles indicate that bears are getting stronger and the trend is reversing. A bearish Doji may also occur before the three black crows, strengthening the possibility of a reversal.
Image: 3 Black Crows
- Falling Three Pattern
This is a 5-candle pattern that indicates continuation of a downtrend. The pattern starts with a bearish candle, which is followed by 3 small bullish candles. The bullish candles are such that the bottom of the first aligns with that of the bearish candle and their tops are increasingly higher. The top of the third bullish candle is close to the top of the bearish candle. The pattern completes itself with a bearish candle with an open price close to the close of the last bullish candle and a closing price below the first bearish candle. It signals that bulls do not have enough strength to reverse the trend.
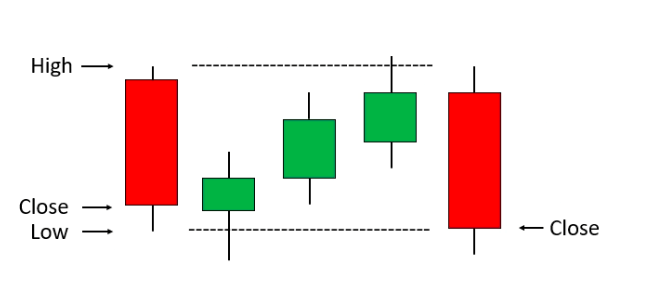
Image Source: https://learn.bybit.com/candlestick/best-candlestick-patterns/
- Rising Three Pattern
The rising three pattern is the inverse of the falling three. This 5-candle pattern indicates the continuation of an uptrend. It starts with a bullish candle, followed by 3 falling small bearish candles. The pattern ends with a bullish candle making higher highs than the previous bullish candle.
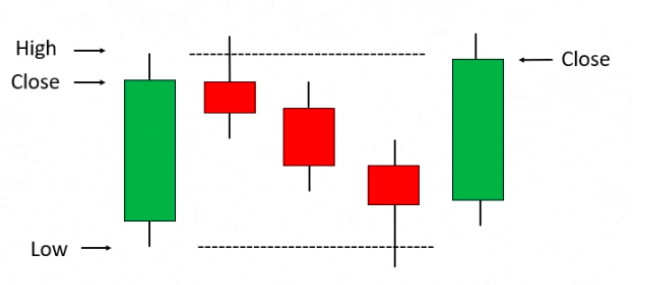
Image Source: https://learn.bybit.com/candlestick/best-candlestick-patterns/
- Bullish Checkmate Pattern
Checkmate patterns occur when the price fluctuation narrows within a range, indicating weakness in momentum and an impending trend reversal. After a sustained bearish trend, the price gets stuck within a range. This indicates a tussle between the bulls and bears with multiple red and green candles. The bodies of the candles are small, with bearish candles getting smaller with every timeframe. A long green candle with a high well above opening price of the last bearish candles signals the onset of an uptrend.
Image: Bullish Checkmate
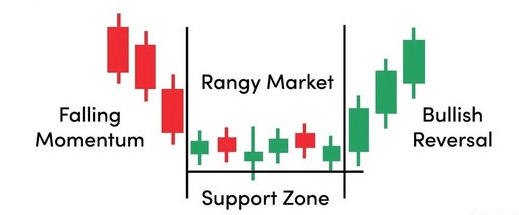
Image Source: https://technicalanalysisworld.quora.com/Whats-the-checkmate-Candlestick-pattern
- Bearish Checkmate Pattern
A bearish checkmate occurs when the price reaches the resistance level but is unable to breach it due to selling pressure. The resistance level is tested multiple times with small bullish and bearish candles. Multiple bullish candles with decreasing body sizes indicate weakening strength in the ongoing uptrend. A long bearish candle completes the pattern and marks a reversal to a downtrend.
Image: Bearish Checkmate
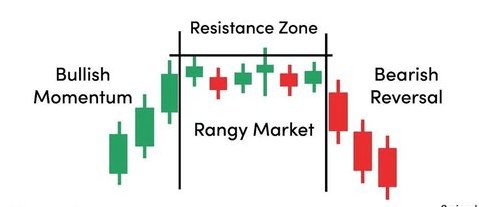
Image Source: https://technicalanalysisworld.quora.com/Whats-the-checkmate-Candlestick-pattern
Bonus: Gaps
Often, the opening price of an asset on a trading day is nowhere close to the closing price of the previous trading day. Such a scenario, where there is a gap between the opening and closing prices, indicates a strong momentum towards the opening direction. The opening price signals strong trader sentiment and sets the direction of the price movement. There are 4 types of Gap openings:
- Gap Up Opening
This occurs during an uptrend, when there is a price gap between two bullish candles. It indicates strong bullish market sentiment.
Image: Gap Up Opening
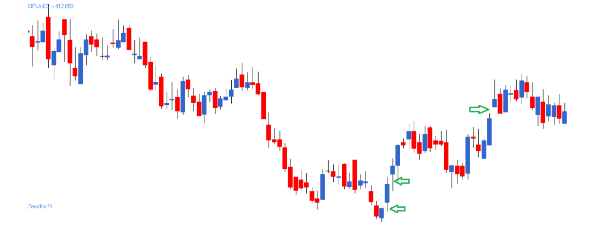
Image Source: https://zerodha.com/varsity/chapter/multiple-candlestick-patterns-part-3/
- Gap Down Opening
This occurs when two bearish candles gap down, indicating strong bearish trader sentiment.
Image: Gap Down Opening
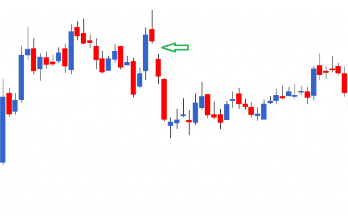
Image Source: https://zerodha.com/varsity/chapter/multiple-candlestick-patterns-part-3/
- Kicker Up Reversal
A Kicker Up occurs after a downtrend, when the price opens much higher than the closing price of the last bearish candle in an ongoing downtrend. It indicates a bullish reversal.
- Kicker Down Reversal
A Kicker Down indicates a bearish reversal. The pattern is identified when a bearish candle opens at a gap from the last bullish candle during an uptrend.
Image: Kicker Gaps
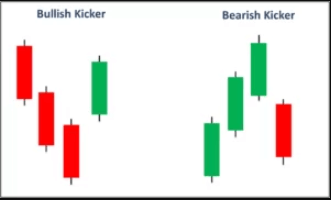
Image Source: https://www.niftytradingacademy.com/blog/most-powerful-candlestick-patterns
Disclaimer:
All data, information and materials are published and provided “as is” solely for informational purposes only, and is not intended nor should be considered, in any way, as investment advice, recommendations, and/or suggestions for performing any actions with financial instruments. The information and opinions presented do not take into account any particular individual’s investment objectives, financial situation or needs, and hence does not constitute as an advice or a recommendation with respect to any investment product. All investors should seek advice from certified financial advisors based on their unique situation before making any investment decisions in accordance to their personal risk appetite. Blackwell Global endeavours to ensure that the information provided is complete and correct, but make no representation as to the actuality, accuracy or completeness of the information. Information, data and opinions may change without notice and Blackwell Global is not obliged to update on the changes. The opinions and views expressed are solely those of the authors and analysts and do not necessarily represent that of Blackwell Global or its management, shareholders, and affiliates. Any projections or views of the market provided may not prove to be accurate. Past performance is not necessarily an indicative of future performance. Blackwell Global assumes no liability for any loss arising directly or indirectly from use of or reliance on such information herein contained. Reproduction of this information, in whole or in part, is not permitted.

