

5 Forex Trading Indicators Every Trader Must Know

The foreign exchange market has the largest daily trade volumes and the highest liquidity. It is a 24/5 market and presents many attractive trading opportunities. Traders typically use technical analysis tools for trading major, minor, or exotic currency pairs. Here’s a look at 5 of the most popular technical analysis indicators.
1. Average Directional Movement Index (ADX)
ADX is a lagging forex trend indicator. It shows the trend’s strength with two directional indicators – +DMI and -DMI. Each DMI is a directional movement indicator representing how current highs, lows, and closing prices relate to the previous day.
The sum of +DMI and -DMI is divided by the average true range (ATR) to get the average directional movement index (ADX). The indicator can be dragged and dropped into the price chart with a single click on MT4 and MT5 and shows up under the chart. All 3 lines – +DMI, -DMI, and ADX – are depicted.
If +DMI is higher than -DMI, the asset is said to be in an uptrend, and ADX measures the strength of the uptrend. Similarly, when -DMI is higher, ADX measures the strength of the downtrend. Typically, ADX > 50 indicates a strong trend to make trading decisions in either direction.
2. Relative Strength Indicator (RSI)
RSI is a very popular momentum strength indicator. It measures the pace and variation of an asset’s price movements. It is a leading indicator of changing momentum and helps indicate reversals. It is calculated as the percentage change over a historical period of 14 days, in the ratio of relative gain to relative loss. The historical windows typically chosen by forex traders are 9 and 25 days.
RSI oscillates between 0 and 100. A value above 70 indicates that the FX pair is overbought. This signals a potential decline in price and that the market is prepped for a reversal. Conversely, a value below 30 suggests that the asset is oversold, indicating a potential bullish reversal. Traders can customise RSI to signal at values 20 and 80. Many traders use a range between 60 and 90 during a bull market and between 20 and 40 during a bear market.
To make entry and exit decisions, traders often wait for an RSI divergence, which is a disagreement between the direction of the price and RSI value. This means either the market will range for a while or reverse soon. When the price makes a higher high, but the RSI fails to make a higher high and stays below the latest swing high, it is said to be a Top Swing Failure and indicates that shorters are gaining strength in the market. Similarly, when the price makes a lower low, but the RSI fails to do the same and instead rises above the latest swing low, it is said to be a Bottom Swing Failure.
3. Bollinger Bands (BB)
BB is a lagging volatility indicator. It reveals the volume behind the price movement. Sudden changes in price movements may generate entry signals. They are formed by a 20-day SMA and two trendlines called the upper and the lower band.
The lower band or the bottom channel is the difference between SMA and a multiple (K) of its standard deviation. The upper band or the top channel is the sum of SMA and K times the standard deviation. The two bands work as dynamic support and resistance levels around the price level. In times of low volatility, the two bands are very close to each other, showing a Bollinger squeeze on the price chart.
A squeeze indicates an impending breakout and is a potential entry point. If the price is trending down and the trendline breaches the lower band, it indicates that a downtrend is setting in, and traders may open short positions. Conversely, if the price breaches the upper band, an uptrend begins, and traders take long positions. Additionally, W-bottoms and M-tops formed by Bollinger Bands (the channel of three bands) indicate reversals in the market.
4. On-Balance Volume (OBV)
OBV is a leading volume indicator that helps traders assess the increase or decrease in the volume of traded assets. It measures the mass sentiment to predict bullish or bearish strength in the market.
During a positive volume pressure, the OBV curve goes up, indicating that the uptrend will continue. Similarly, when negative volume pressure increases, the OBV curve declines, suggesting that the downtrend may continue. A sharp rise in the OBV line, accompanied by high momentum, indicates that big traders are entering the market. This is a sign of trend reversal if OBV and trading volume go in opposite directions. A trend continuation is indicated by OBV and trading volume moving in the same direction.
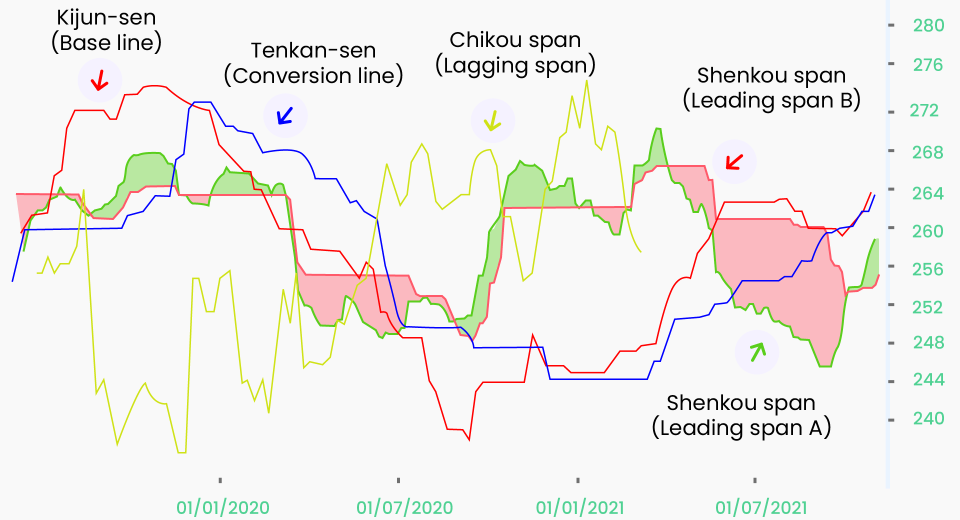
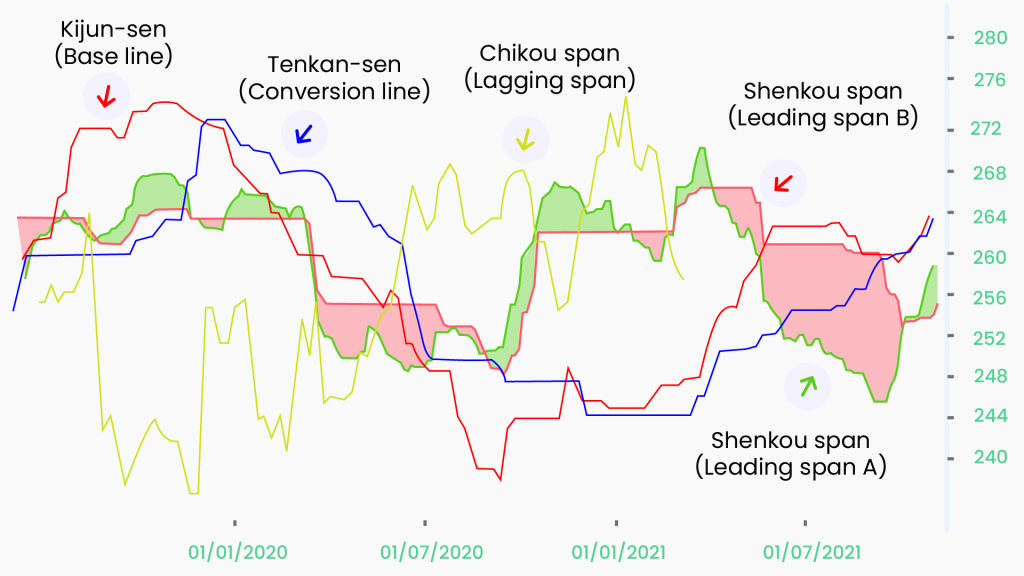
5. Ichimoku Kinko Hyo (Ichimoku Cloud)
Ichimoku cloud is a popular indicator with multiple elements to create a comprehensive trading strategy. It helps traders discover higher-probability trading opportunities. It has 5 components that help traders make informed decisions:
- Tenkan-Sen (red line on the chart) is a moving average of the highest and lowest low of the last nine periods.
- Kijun-Sen (blue line) is the base line formed by taking the average of the highs and lows of the last 26 periods.
- Senkou Span A is the average of the highs and lows of the Tenkan-Sen and Kijun-Sen.
- Senkou Span B is the average of the highs and lows of the last 52 periods.
- Chikou Span (green line) remains below the price in bearish markets and above the price in bullish markets.
The Komu cloud works as a trend indicator. It is the region between Senkou Span A and Senkou Span B. If the price is trending below the cloud, the market sentiment is said to be bearish. Price trending above the Komu cloud indicates an overall bullish market sentiment. The cloud becomes thicker when volatility increases, giving more insights to traders about the market.
Trading Forex with CFDs
These indicators work effectively in both spot markets and trading via CFDs. Traders often use CFDs to trade Forex with leverage, enhancing purchasing power. While this amplifies the profit potential, it can also increase potential loss if markets don’t move as expected. It’s a good idea to use risk management techniques, such as stop loss and portfolio diversification when trading Forex.
Disclaimer:
All data, information and materials are published and provided “as is” solely for informational purposes only, and is not intended nor should be considered, in any way, as investment advice, recommendations, and/or suggestions for performing any actions with financial instruments. The information and opinions presented do not take into account any particular individual’s investment objectives, financial situation or needs, and hence does not constitute as an advice or a recommendation with respect to any investment product. All investors should seek advice from certified financial advisors based on their unique situation before making any investment decisions in accordance to their personal risk appetite. Blackwell Global endeavours to ensure that the information provided is complete and correct, but make no representation as to the actuality, accuracy or completeness of the information. Information, data and opinions may change without notice and Blackwell Global is not obliged to update on the changes. The opinions and views expressed are solely those of the authors and analysts and do not necessarily represent that of Blackwell Global or its management, shareholders, and affiliates. Any projections or views of the market provided may not prove to be accurate. Past performance is not necessarily an indicative of future performance. Blackwell Global assumes no liability for any loss arising directly or indirectly from use of or reliance on such information herein contained. Reproduction of this information, in whole or in part, is not permitted.

