Hammer Patterns Analysis for Beginners

Candlestick patterns are one of the most versatile tools used for understanding the movements of the market. The patterns have developed from a unique technique used by Japanese businessman, Munehisa Homma, in the 1700s. The technique was used for tracking the price of rice. The Hammer patterns proved to be so successful that they soon became the basis for trading any liquid commodity in Japan.
Over the years, many different types of candlesticks have been developed for different market conditions. Among them, one of the most popular is the hammer candlestick patterns. If you are unsure about what it is, here’s a guide to hammer trend analysis for beginners.
What are Hammer Patterns?
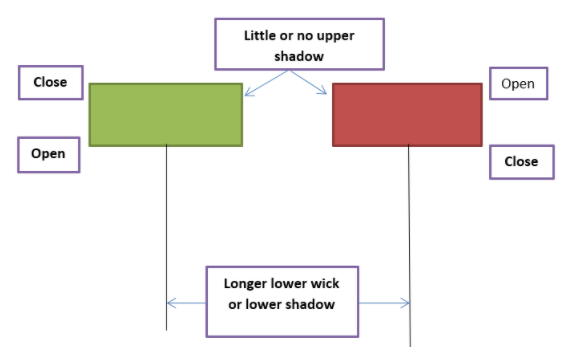
Hammer candlestick patterns are created when the price of a security trades considerably lower than the opening price. But the price than rallies to come close to the opening price. This price behaviour creates a candlestick pattern shaped like a hammer. In hammer candlesticks, the lower shadow is at least 2 times longer than the real body.

Since the opening and closing prices are quite close to each other, these patterns have a small body. A long shadow represents a large difference between the high price and low price of the timeframe.
Sometimes, a hammer pattern is confused with a Doji candle because of their similar structure. Doji candles also have a small real body but the candle points towards indecision in the market, since it has both a lower and an upper shadow. Depending on the confirmation afterwards, a Doji candle can signal a trend continuation or a price reversal. This is the main difference between the two types of candle patterns.
What is an Inverted Hammer Pattern?
An inverted hammer pattern usually forms near a downtrend. In this case as well, there is a long shadow and a small body. But the body is at the bottom, opposite to the regular pattern. The long upper shadow indicates that the buyers have driven an increase in the price of the asset, during the formation period of the candle. But the prices declined due to selling pressure, closing near the opening price.
Some traders confuse the inverted hammer pattern with the shooting star. Although they are similar in appearance, they are different in many other regards. Unlike the inverted hammer, a shooting star is a bearish signal, which appears at the top of an uptrend.
What You Can Learn from Candlesticks Patterns
Hammer candlesticks generally form when the market has been declining for some time. This indicates that the market is trying to create a bottom. With the pattern forming, it is indicated that there can be a capitulation from the buyers to create a bottom. Capitulation is the process of traders giving up their previous gains in an asset during periods of decline. Capitulation also signals the creation of a bottom.
Once the bottom has been created, this pattern points towards a possible reversal of the price direction. All this takes place during a single timeframe. The price falls and then regroups to close near the opening price.
A hammer formation with the high and closing price close to each other is considered a bullish candlestick. This is considered a strong pattern, as the bulls are able to not just fight off the bears but push the price higher than the opening price. The hammer pattern is also considered bullish when the opening and high prices are the same, but not as strong. This is because the bulls were able to negate the influence of the bears, but they could not push the prices higher.
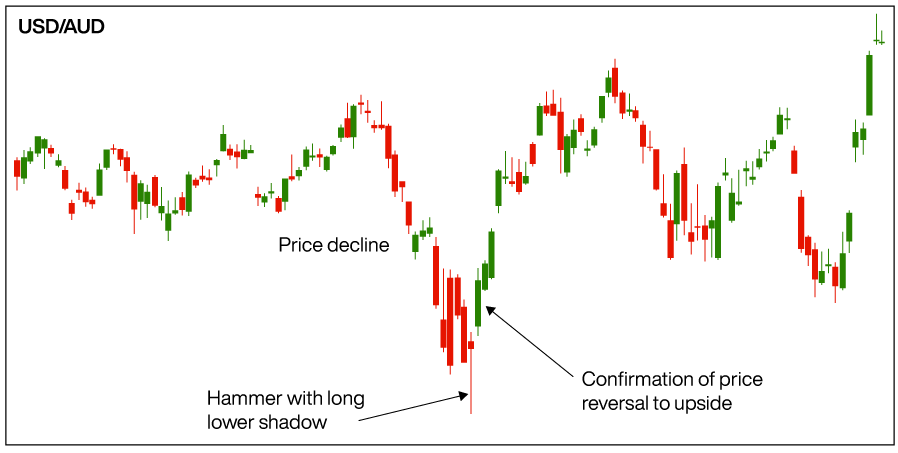
A hammer pattern is confirmed to have formed when it is preceded by 3 or more falling candles. A falling candle is one that closes at a lower price than the previous candle. In appearance, a hammer pattern should resemble the “T” shape. The confirmation of the pattern occurs when the candle after the hammer closes above it. This shows a strong buying tendency in the market.
How to Trade with Hammer Patterns?

In the above chart, you can see that the price is gradually declining. Finally, a hammer candlestick pattern is created. This pattern has a shadow that is multiple times longer than the real body. The hammer pattern created points towards a possible reversal in price direction. The next candle, which closes above the hammer, confirms the formation of the pattern.
Traders generally step in to buy during this confirmation. At the bottom of the hammer, a stop loss signal is placed. If the price keeps moving higher than the confirmation candle aggressively, the stop loss can even be placed below the real body of the hammer.
Hammer patterns can be incredibly helpful in identifying a trend. But the upwards movement is not 100% guaranteed, even after the confirmation candle has formed. Another limitation of the candle is that they do not provide a price target. Therefore, it is recommended to use hammers along with other technical indicators and chart patterns.
Did you enjoy reading Hammer Trend Analysis for Beginners? If yes, hit share.


