

How to Trade Range-Bound Markets
Trend trading is a popular strategy because the price movement is quite apparent. However, contrary to what beginners believe, the financial markets range more often than they trend. The price of an asset fluctuates between a high and a low value about 75% of the time. Continuous uptrends and downtrends within a specific range create numerous opportunities for traders to take advantage of. Read on to learn all about trading range-bound markets.
Identify a Ranging Market
The price bouncing between an upper and a lower level characterises a ranging, horizontal, or sideways market. Bullish and bearish forces are almost balanced in ranging markets.
- The higher level is the resistance, where bulls are unable to push the price higher.
- The lower level is the support, where bears cannot drag the price lower.
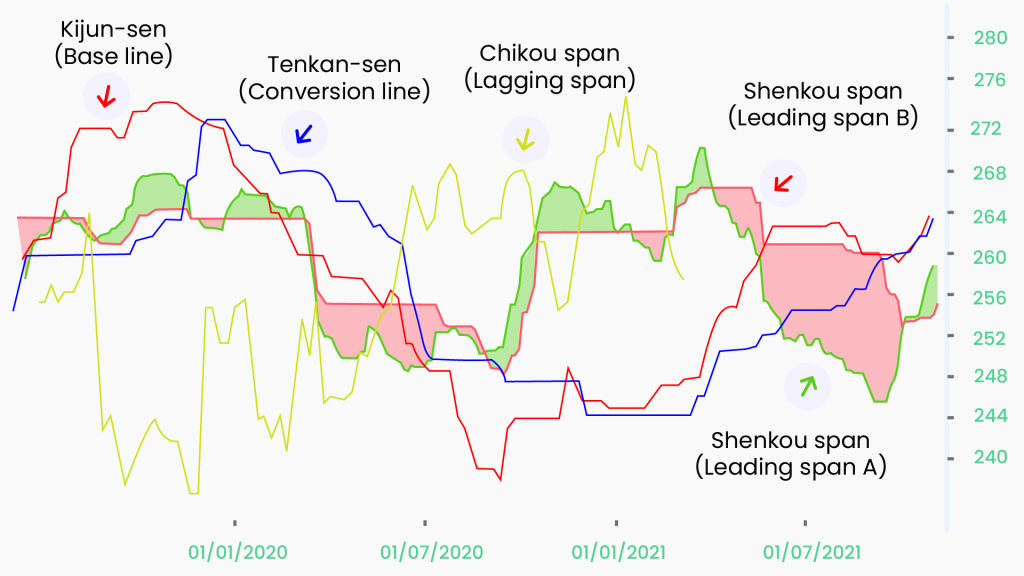
Traders popularly use technical indicators to identify range-bound markets.
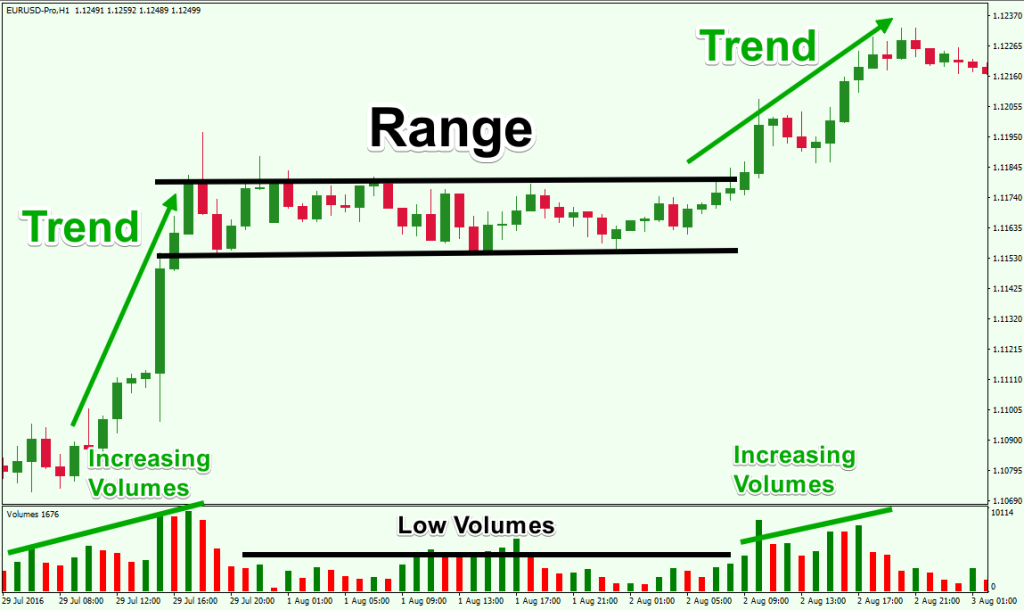
Image Source: https://forextraininggroup.com/range-bound-market-strategies-explained/
Trend Lines
The easiest way to identify sideways ranging markets is to draw trendlines of the highs and lows. The trendlines in a ranging market appear flatter, since the highs and lows tend to be close to each other. When the trendlines have a high slope, the market is trending.
Fibonacci Indicator
In range-bound markets, the price bounces off the 0.5 Fibonacci retracement level. This means the 50% level either works as resistance or support.
Average Directional Index (ADX)
ADX is a momentum strength indicator. It quantifies the strength of a trend. A value below 25 characterises a weak trend, which is often a ranging market. When the ADX crosses over 30, an uptrend or downtrend begins. ADX does not identify the direction of the trend. It can only indicate its strength.
Bollinger Bands (BBs)
The width of the BBs signals volatility in the price. Narrow or contracted bands indicate that volatility is low. There is little movement of the price in any one direction. This signals a ranging market. As the bands begin to widen, increased volatility signals the possibility of a trend setting in.
Pros and Cons of Range Trading
Range trading is straightforward and applicable to a diverse class of assets, including indices and forex. Derivative instruments, such as CFDs, enable traders to take advantage of rising and falling prices in ranging markets. But remember that range trading has a shorter turnaround time than trending markets.
There is always a risk of breakouts in range trading. Therefore, experienced traders employ robust risk management techniques.
Range Trading Strategies
Range trading is the technique of finding and capitalising on entry and exit points in consolidating markets. There are two popular ways to do this:
- Trading a Bounce-Off
The price trends up or down within a range. Trading a bounce off the resistance or support levels involves identifying the exact points at which the price may bounce back within the range.
- Trading Breakouts
The financial markets often go into overbought or oversold territory, and price corrections bring them back within the range. However, at times, especially when there is poor acceptance of the price, a trend may begin. The price either breaches resistance to begin an uptrend or breaks out below support to start a downtrend. Traders identify such opportunities to take advantage of the beginning of a trend.
Technical Indicators for Range Trading
A critical aspect of trading range-bound markets is precise timing. Here’s a look at some of the popular indicators to identify entry and exit points.
Pivot Points
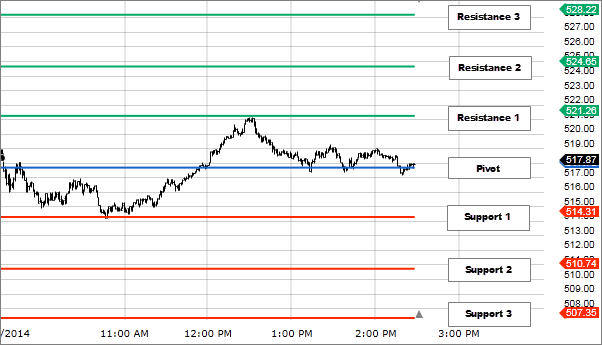
Pivot points are overlay indicators that help traders identify the range and trend intensity for different timeframes. They help in the bounce-off trading strategy. Price levels are calculated by averaging intraday highs and lows and the closing price of the previous trading day. Pivot lines are mapped out to predict likely support and resistance levels for the following days.
- P or the Pivot line works as the reference line.
- S1 (upper) and S2 (lower) are two different support levels.
- R1 (lower) and R2 (upper) are the two resistance levels.
Although traders can personalise their Pivot Point, and hence the S and R levels, most trading platforms use advanced analytics to automate these levels. Additionally, there can be multiple support and resistance levels, based on the asset class and trading strategy.
Trading Strategy Using Pivot Points
The two S and R levels mark the bounce-off ranges. If the price does not bounce off S1 and momentum is strong, it may breach S2 and a downtrend may begin. On the other hand, if momentum is weak, the price may still bounce off S2 and continue to stay in the range. Traders generally use other indicators to identify the strength of the momentum and market sentiment to speculate on the price action.
Relative Strength Index (RSI)
The RSI indicator is an oscillator between 0 and 100. Traders popularly use it to identify entry and exit points.
- A value above 70 indicates an overbought market, signalling that the price is due for a reversal.
- A value below 30 means that the asset is oversold, and the price is due for an uptick.
The default duration for the RSI indicator is 14 days, although traders can adjust the timeframe according to the sensitivity of their trading strategy. A 12-day RSI would reach overbought or oversold conditions much faster than a 24-day one.
Trading Strategy Using RSI
When an asset is trading close to the support level, and RSI indicates an oversold market, it signals the beginning of a bullish trend. This is taken as an indication to open a long position. On the other hand, if the price is hovers around the resistance level with the RSI is in the overbought territory (above 70), and traders assess a strong downward momentum, it is taken as a signal to open a short position.
To Sum Up
- Ranging markets mean that the price of an asset stays bound within an upper and lower price level.
- Indicators such as trendlines, Bollinger Bands, ADX and Fibonacci levels help traders identify whether the market is moving sideways.
- Two popular ways to trade range-bound markets are trading a bounce-off and trading a breakout.
- Pivot points are a popular technical indicator for trading a reversal in horizontally moving markets.
- RSI helps traders identify entry and exit points to trade breakouts in sideways markets.
Disclaimer:
All data, information and materials are published and provided “as is” solely for informational purposes only, and is not intended nor should be considered, in any way, as investment advice, recommendations, and/or suggestions for performing any actions with financial instruments. The information and opinions presented do not take into account any particular individual’s investment objectives, financial situation or needs, and hence does not constitute as an advice or a recommendation with respect to any investment product. All investors should seek advice from certified financial advisors based on their unique situation before making any investment decisions in accordance to their personal risk appetite. Blackwell Global endeavours to ensure that the information provided is complete and correct, but make no representation as to the actuality, accuracy or completeness of the information. Information, data and opinions may change without notice and Blackwell Global is not obliged to update on the changes. The opinions and views expressed are solely those of the authors and analysts and do not necessarily represent that of Blackwell Global or its management, shareholders, and affiliates. Any projections or views of the market provided may not prove to be accurate. Past performance is not necessarily an indicative of future performance. Blackwell Global assumes no liability for any loss arising directly or indirectly from use of or reliance on such information herein contained. Reproduction of this information, in whole or in part, is not permitted.

